
Welcome to another weekly global macro roundup. I struggled with my thesis as it seems as if there is a plethora of narratives to choose from: yield curve flattening, interest rates, global credit, dollar, crude oil. And the Minsky Moment, writes Nell Sloane Wednesday.
As my long-time readers know, I just don’t write to write, it has to have meaning, has to have substance and above all else engagement for you, the reader. So, I decided that I would touch briefly on various things and not go too far into any singular issue.
What I want to do first is give you the trading, investment and economic thoughts and then move onto a few other topics that I think are important for you guys to dig further into on your own.
Many studies have shown that by actively engaging in reading and research, you build a cognitive process and this process aids in the development of memory and understanding. That is why I encourage you to be inspired by what I write in hopes you end up doing a bit more reading on the very topics I bring up. Anyway, let’s get to it…
**
Yield curve: OK, what’s been circling around the financial sphere’s lately? What seems very obvious to me is that there has been an extreme focus upon the flattening of the U.S. yield curve. As a long time, fixed income basis arb, this outcome is purely fundamental from a hawkish and tightening Federal Reserve.
Yield curve flattening, which is nothing more than short rates moving faster than long rates for a given interest rate shift and is usually attributed to an expected higher interest rate environment. Now this doesn’t mean the yield curve can’t flatten if interest rates fall. They certainly can, but generally they are of the bear market form.
What do we mean by bear market in interest rates? It means that the prices of bonds are falling and the corresponding interest rate is rising, price and rate are inverse. I have chosen the following chart to display this visually:
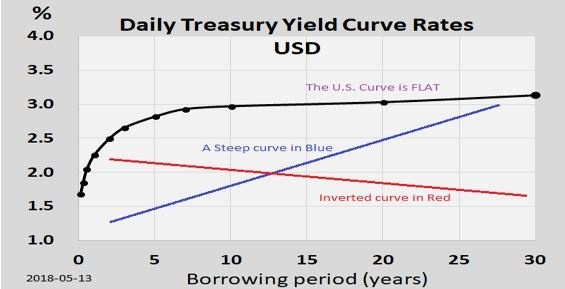
The black line represents the current U.S. Treasury yield curve and it is obviously flat, which should seem strange to any investor because it doesn’t make sense to loan someone money for a longer period of time and receive the same interest rate, does it?
No, it doesn’t, and it shouldn’t, but many forces are in play. Wait till we go inverted that will really blow your mind! The blue line represents a “normal” yield curve where the interest rate (%) rises as time (years) rises. This makes more sense, right? Then the red line is clearly an “inverted” yield curve, the alleged holy grail predictor of recessionary times.
I am not sold on that idea of its predictability. Rather, I believe the inverted curve to be a highly central bank-driven construct that is less deterministic and more intrinsic based purely on raising the cost of funding in a highly leveraged system.
So, for me it’s more backward looking than forward. Meaning recessions form because money becomes tight and capital is withdrawn and is exacerbated by the artificial support of interest rates by central banks in the first place.
Any novice can look at the slope of the red line and say, that doesn’t make sense, why would the demand for an interest rates be greater for a shorter period of time? I could simply borrow money at the long end and sell the higher rate at the shorter end and lock in profit!
Yes, you could, and you would then be an expert bond arb like myself. However, it is not that easy, trust me, but the fundamentals of that arbitrage are what eventually brings it back into line!
**
Counter what? One thing that most people don’t think of is, counterparty risk, at least they don’t think of it until it’s too late.
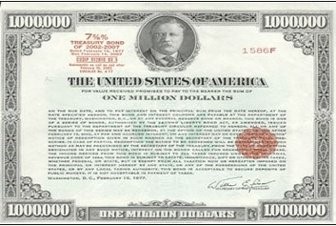
What risk does the U.S. Treasury bond have…plenty. And there are reasons why peripheral EU countries pay less for borrowing money then our very own “safety net” U.S. Treasury bond!
Those fundamentals are for another day, a day in the future I am sure, but this should pique your interest as to why and how the cost of money truly affects things. You have been sold the fact that lower interest rates are good for you, they lower the cost of money.
What they haven’t told you is the very fact that investments that come from borrowing are exponentially different from investments that are made with savings.
As a saver would you rather earn 8% on your 1-year T-bill or be able to borrow more money at 1%?
The answer should be quite obvious. And if it isn’t, we highly suggest you continue to watch the U.S. debt pile up and then ask yourself: can the U.S. taxpayer continue to expand their debt obligations while interest rates rise?
**
Interest rates and credit: Every investor I talk to knows equities, but they rarely follow bonds, which is a mistake. In a debt and fiat monetary system, interest rates and their flip side, credit, determine aggregate nominal prices.
The system is designed to always increase in price or inflate. This phenomenon is most unfortunate for the majority, but extremely fortuitous for a select few.
The problem with a fiat monetary system is debt must constantly expand or else the aggregate price level will collapse.
I believe the price level collapses anyway purely by the weight of the debt that is accumulated. Not only will nominal asset prices fall, but in general the purchasing power of the consumer erodes as well.
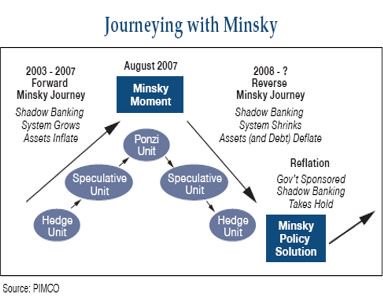
Austrian economists call this the Minsky moment, named after in my opinion one of the greatest American economists ever, Hyman Minsky.
Maybe I am partial to the fellow Chicagoan, or maybe it’s the fact he was highly critical of Keynes’ neoclassical interpretations. I’ll take either one as admission.
It doesn’t take a genius to figure out that debt can only be sustainable if more and more is created. This type of system is the one we unfortunately adhere to. Will this change?
I believe so and the moment everyone is so desperately trying to avoid will eventually arise, it always does. Here is a great chart from PIMCO:
**
Perhaps the central banks should consult this French poet’s quote in order to learn something:
“A person often meets his destiny on the road he took to avoid it” --Fontaine
With all this in mind, it is no wonder the equity markets have gone nowhere since January. The Federal Reserve continues to raise not because they want to, but because they have to.
They will need room to maneuver for the coming recession and they know rates were way to low causing the elites and corporations to take full leveraged advantage.
**
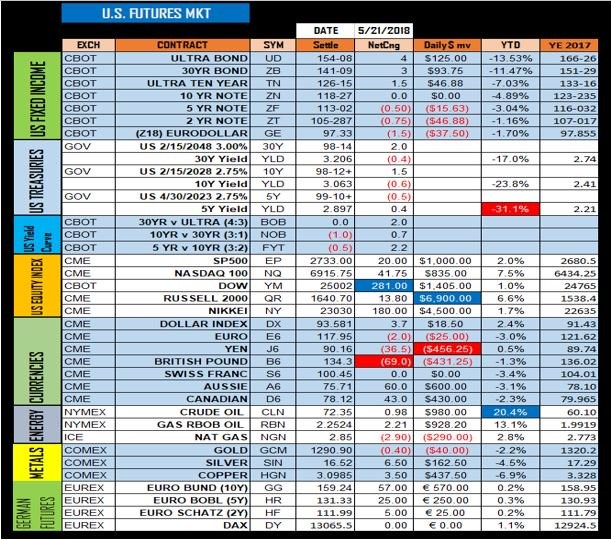
The S&P 500 (SPX) put in a high back on January 26 at 2872.87 and we haven’t even come close since. The S&P 500 trades near 2725, some 5% off the highs.
The longer the market fails to even take a clean shot at new highs the greater the odds of a stronger sell off, in fact another trade below 2650 should bring in a host of new sellers.
As far as fixed income, the U.S. Treasury yields continue to push the upper limits. In fact, it marked the first time in 10 years the 2-year Treasury coupon came with a 2.5% interest rate.
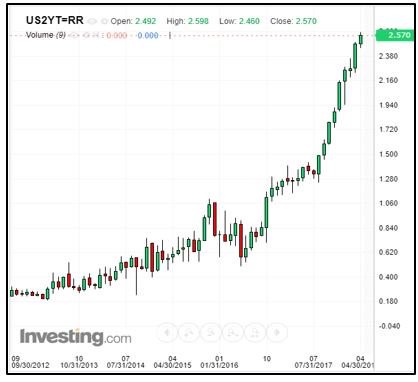
Ten years is a very long time and if this doesn’t wake you up, then nothing will.
**
Things have changed and the markets will not be able to fight this change much longer. Will this higher rate push continue? Possibly but it will have repercussions if it does, so as investors and traders, the risk radar should be ringing. Then again, everyone’s tolerances are different, but I know one thing is constant across the investing spectrum and that is nobody likes losing money!
With the U.S. 10-year trading around 3% I still feel this general area is a magnet and expect further trade around it.
**
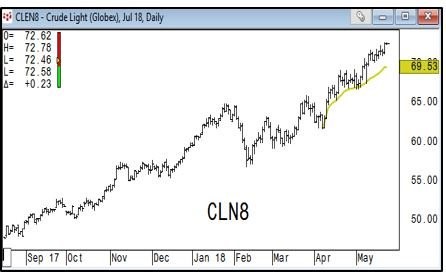
Crude shines: Moving on to other markets, Crude Oil continues to shine, up some 20% this year and continuing its ascent, despite a stronger dollar lately.
Here is a nice chart from my friend at Keystone Charts:
**
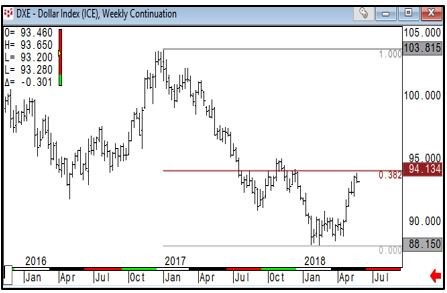
Speaking of the dollar’s strength, I feel like the move is a bit long in the tooth here for the short run and some consolidation to lower is in order. This resistance does correlate with some short-term support in the euro around the 117-35 level.
Here is another chart from Keystone showing clear resistance near the 94.13 level
We hope enjoy the rest of your week. Cheers!
Nell
Subscribe to Nell Sloane's Unique Insights and Crypto Corner newsletters here


