

Here are six long-term charts where I expect major shifts ahead: Global Equity, USD, S&P 500, Gold, TSX and Oil, writes Ziad Jasani July 1.
View my Market Strategy Session

Recorded: 11:15 am, July 5, 2018,
Duration: 1:10:58.
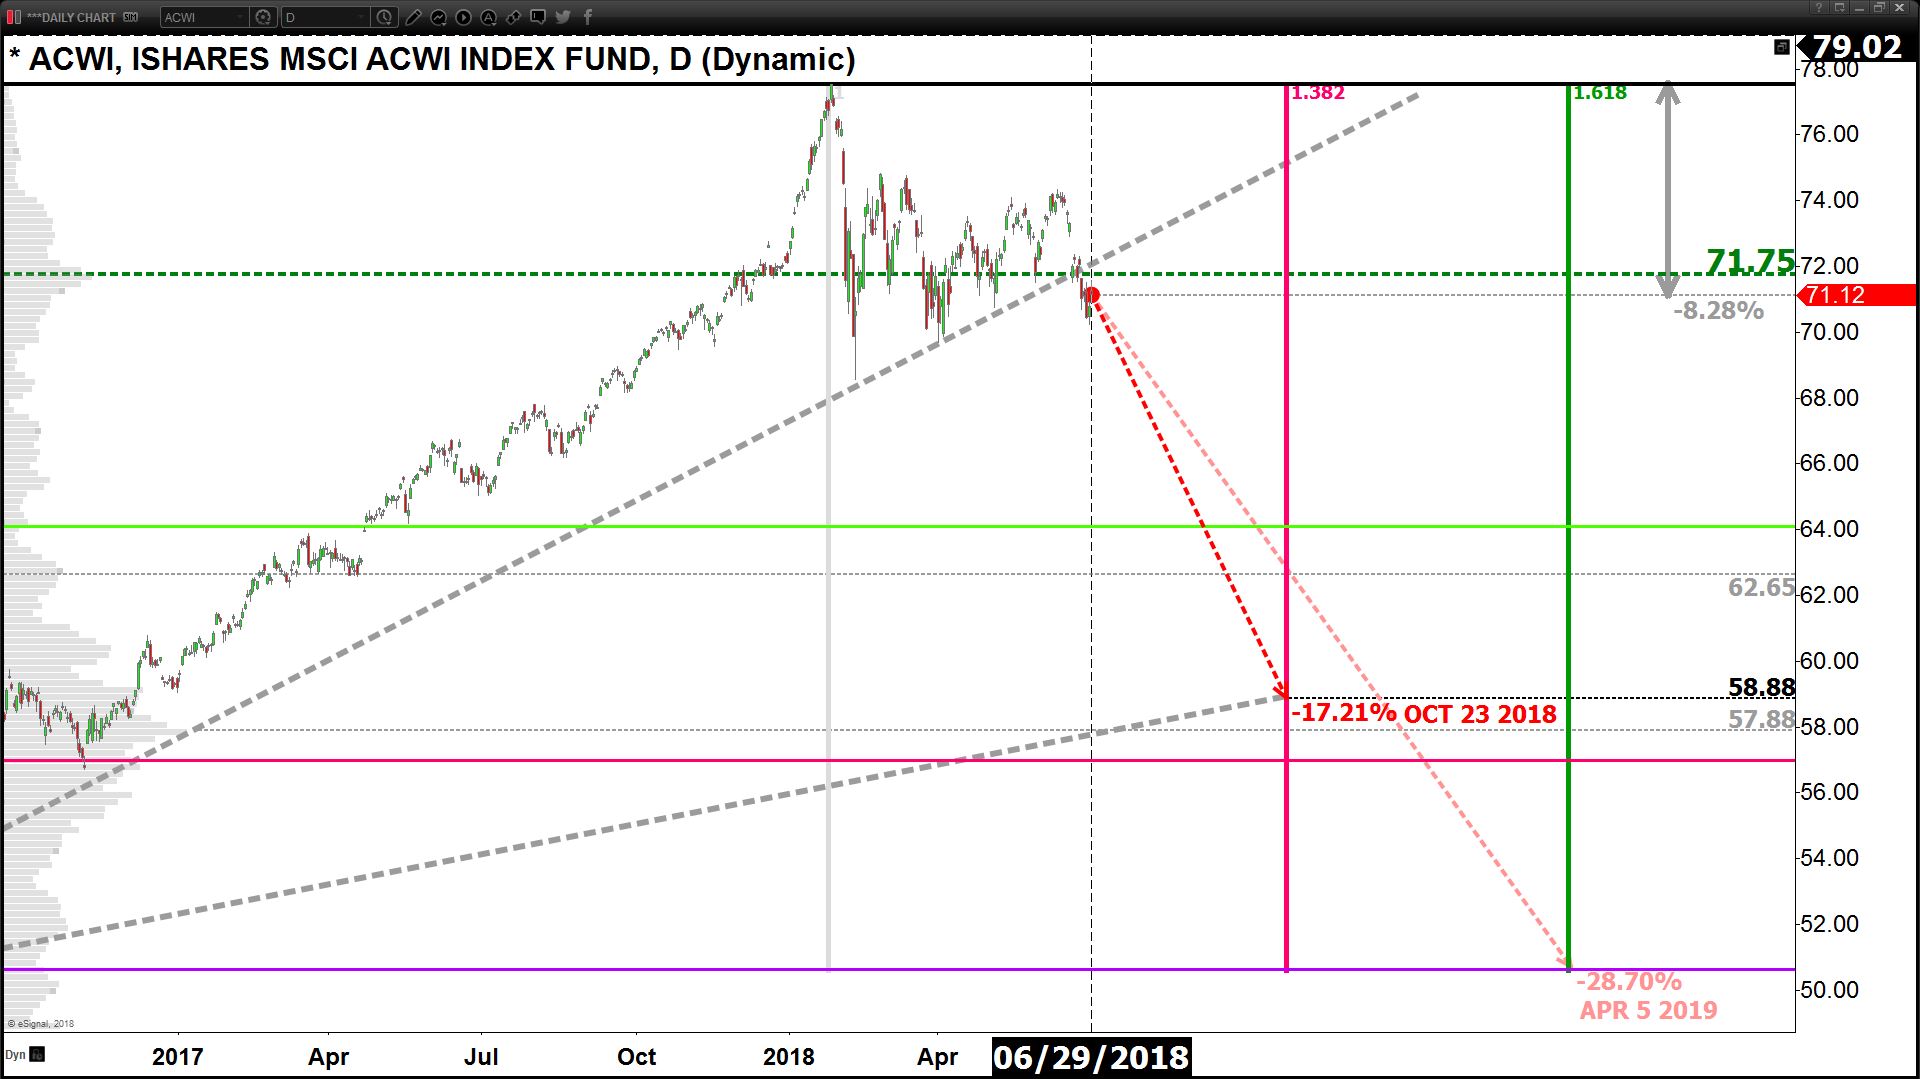
Global Equity Market (ACWI): The accelerated uptrend starting Jan 2016 has broken.
Using fibo retracement and time-lines, we are expecting global equities down -17% by Oct. 23, 2018.
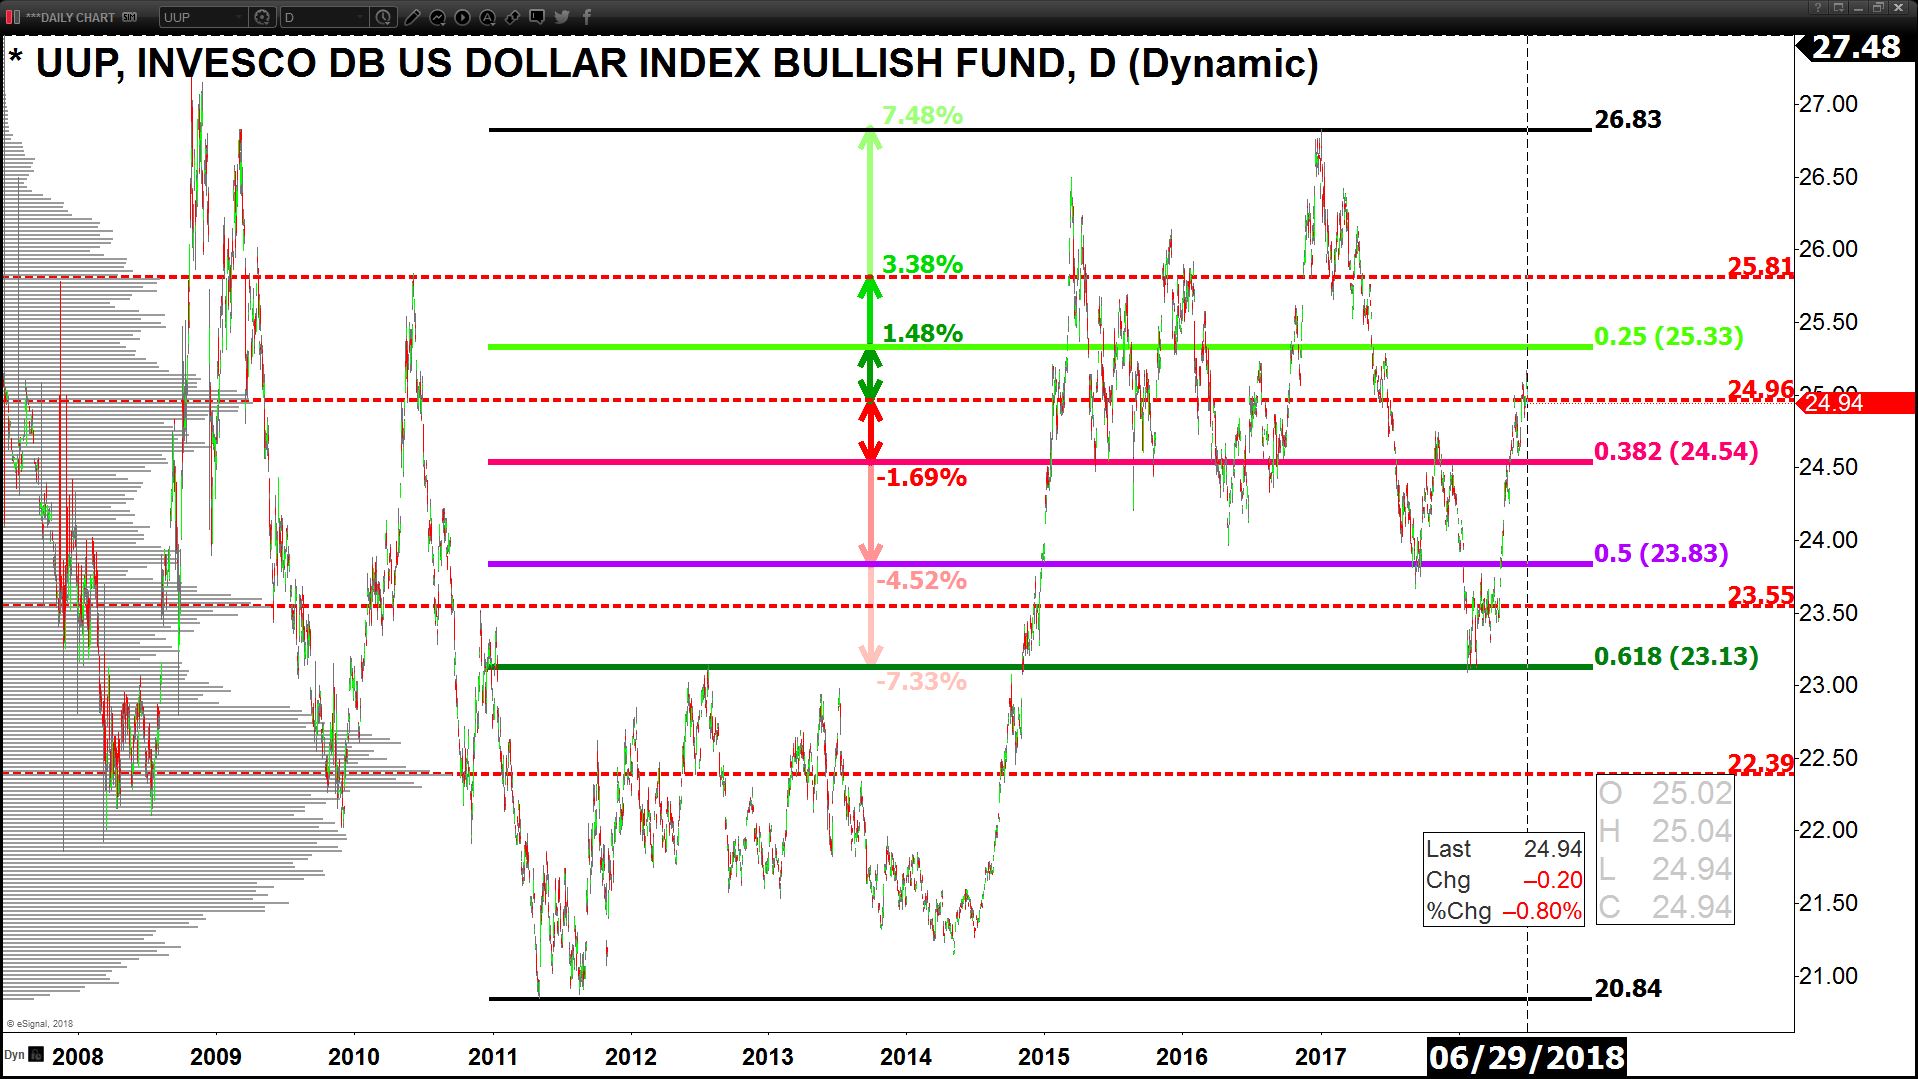
USD (UUP): With Quantitative Tightening (QT) and rate normalization on course for the USD by the Federal Reserve, we can expect the USD to strengthen +3.4% to +7.5 in the back half of 2018, but a short-term cooling of -1.7% is expected first.
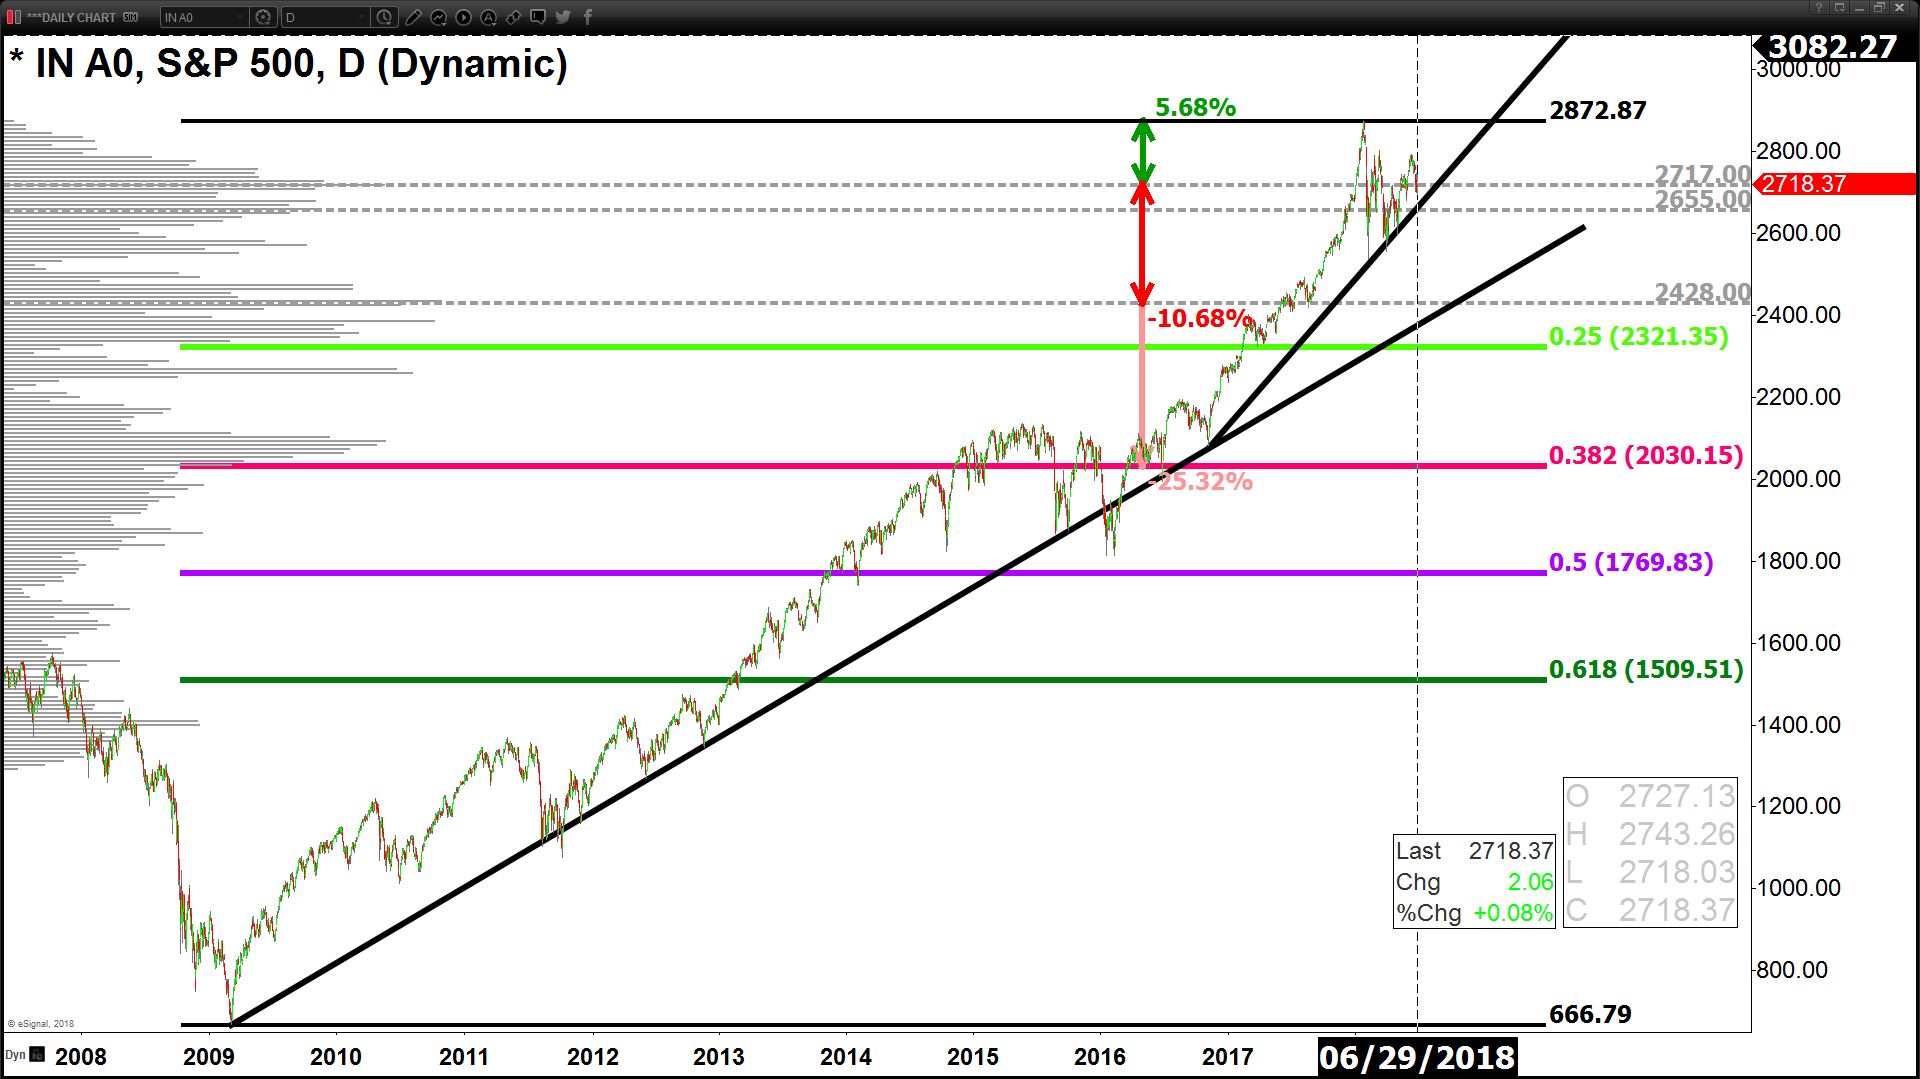
S&P 500: Following the path pf the expected drop in Global equity markets (above), the S&P 500 is likely to outperform by declining at a slower pace with a roughly -11% drop in the back half of 2018.
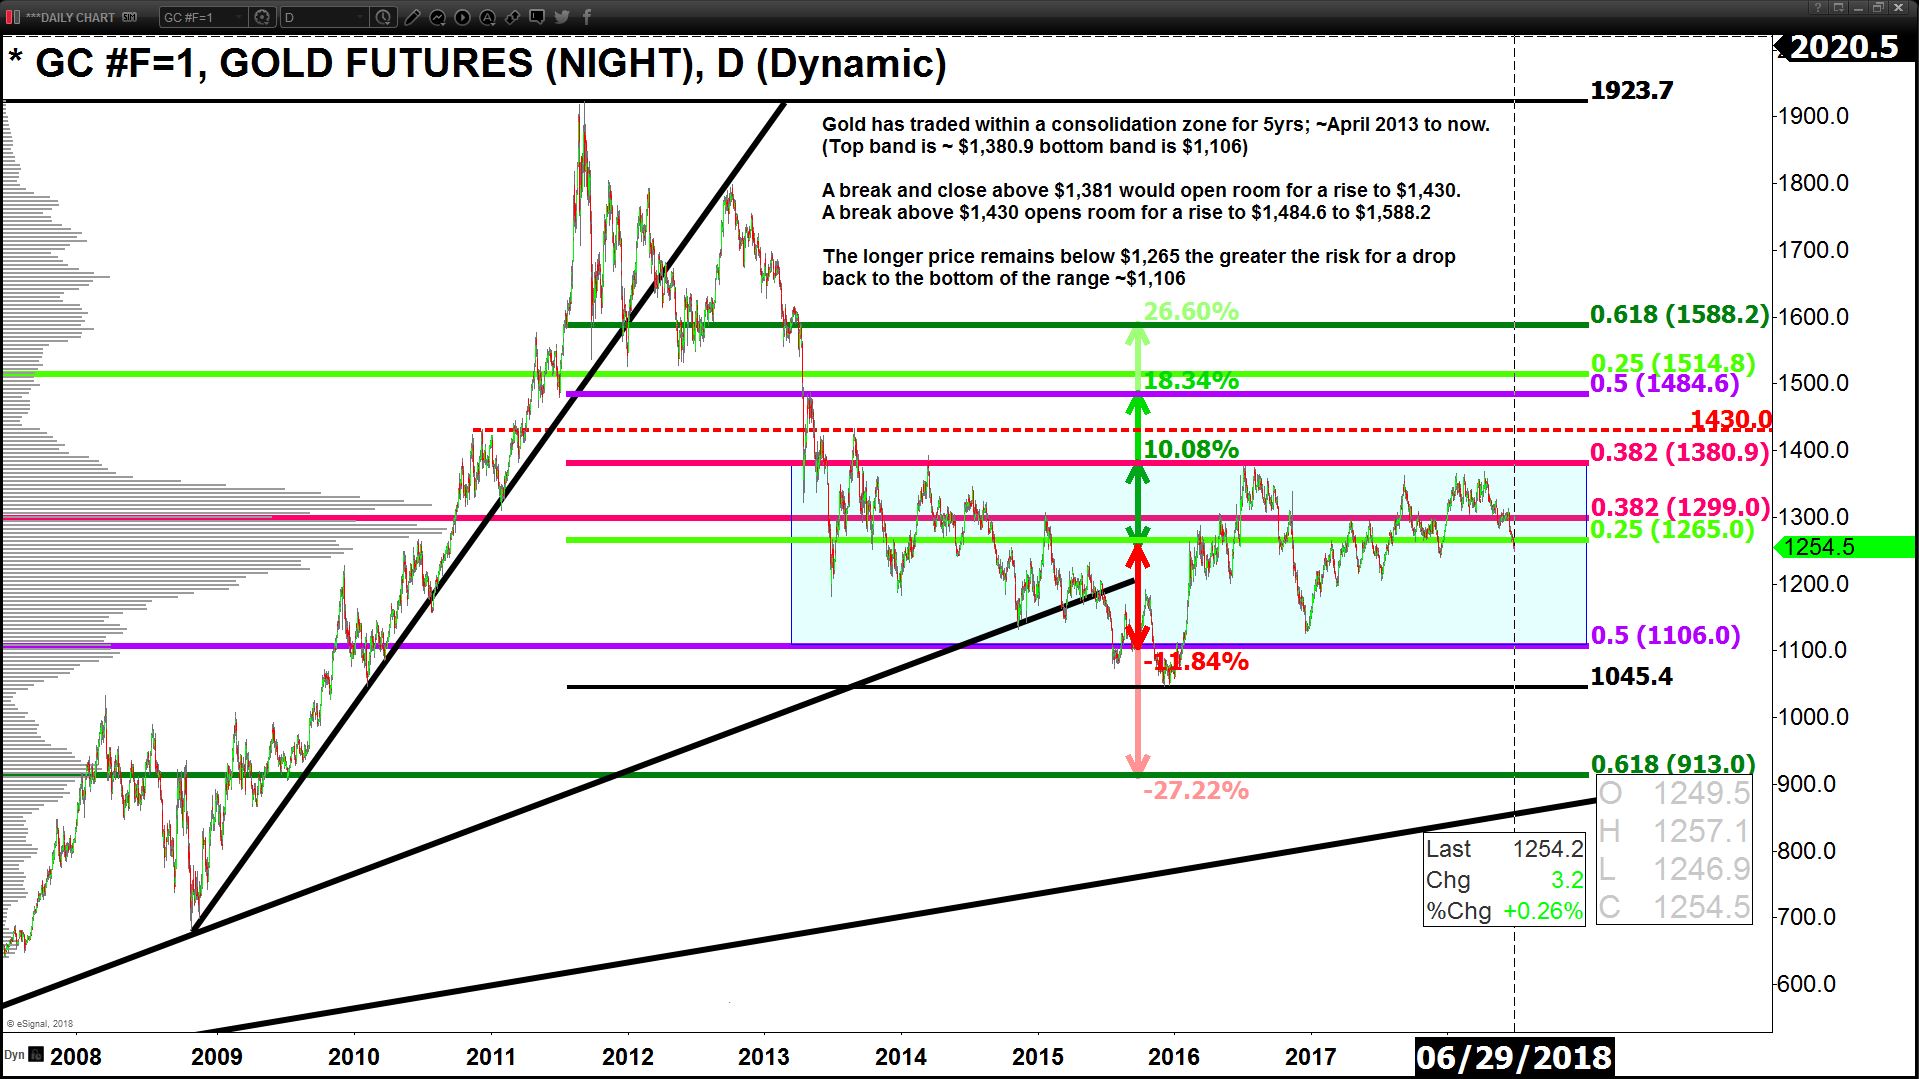
Gold: Gold is stuck in a long-term range ($1,380.9 - $1,106), and less likely to break-out this year as QT and rising rates continue to strengthen the USD. However, in the short-term a bounce is expected that can take gold back up to $1,267 to $1,286.
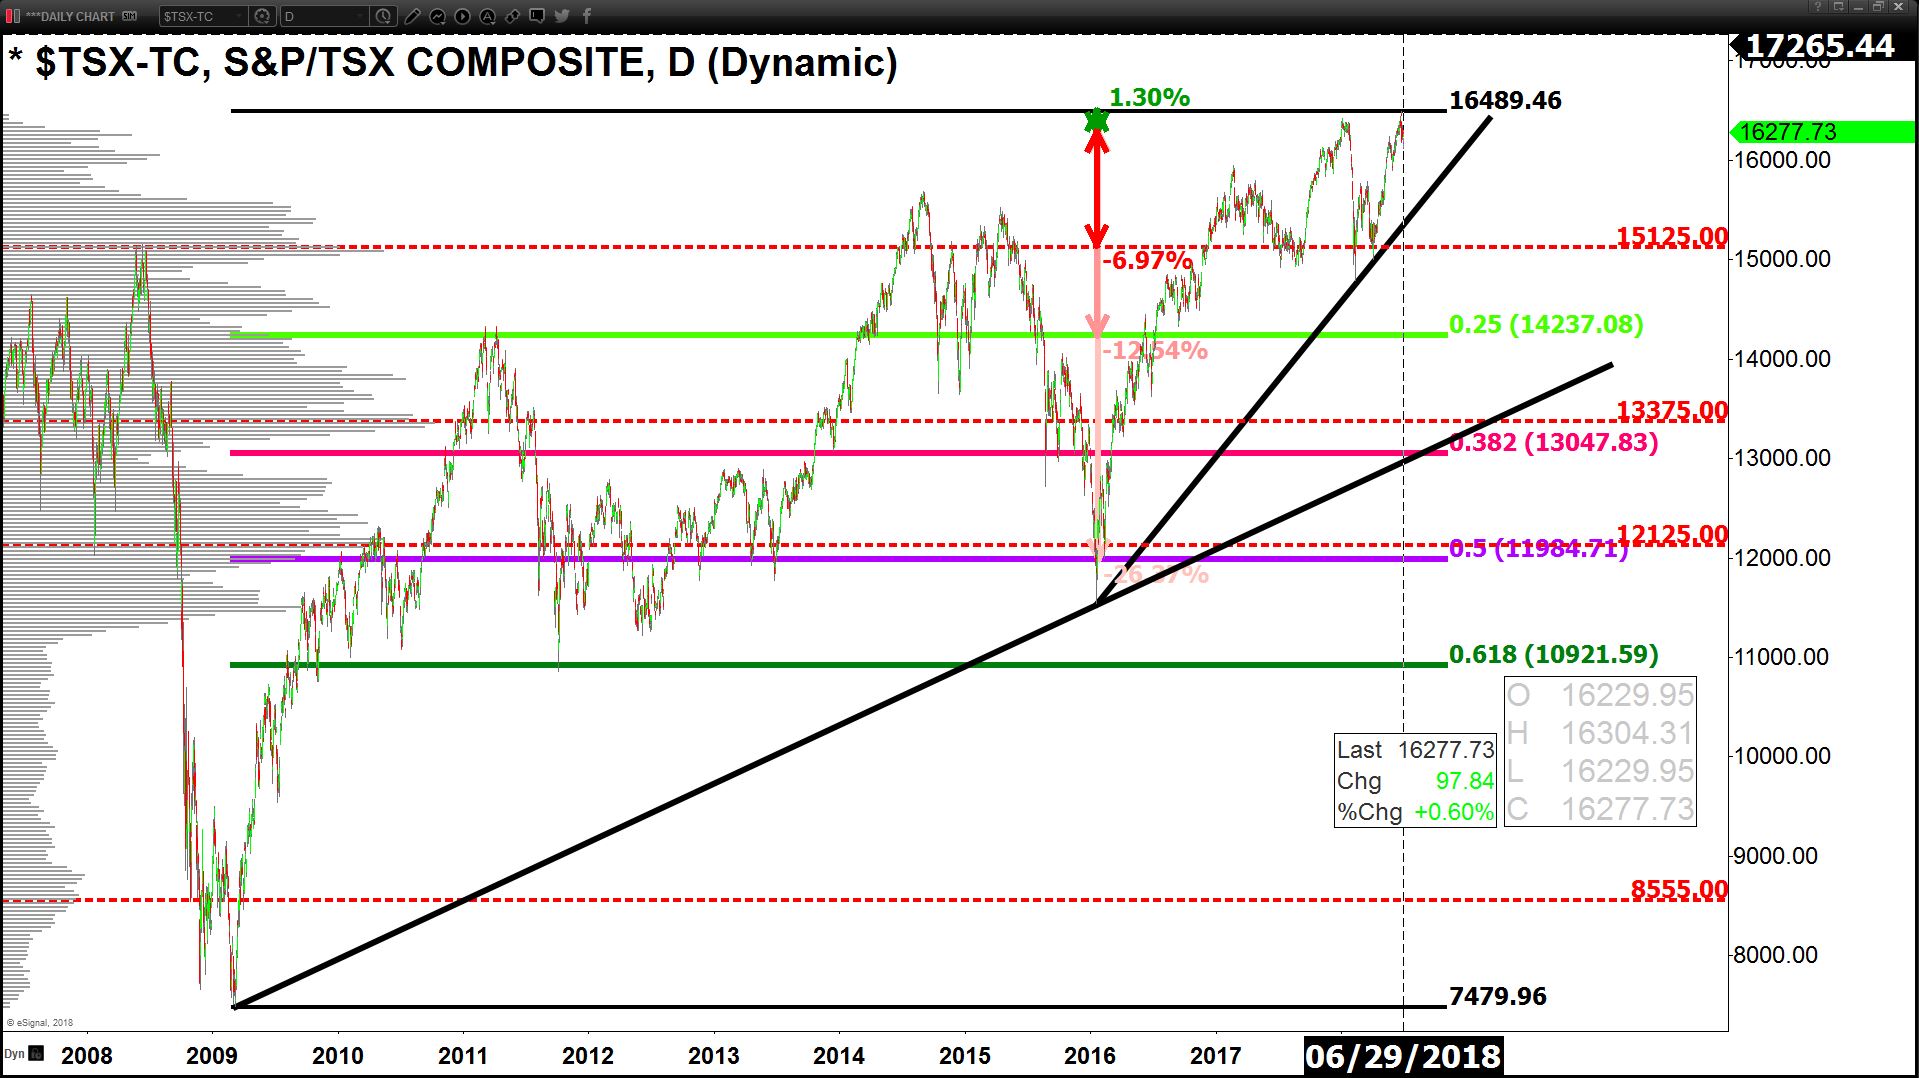
TSX: A -12.5% drop taking the TSX to 14,237 is expected in the back-half of 2018. Once support at 15,125 is violated we can expect the move to begin.
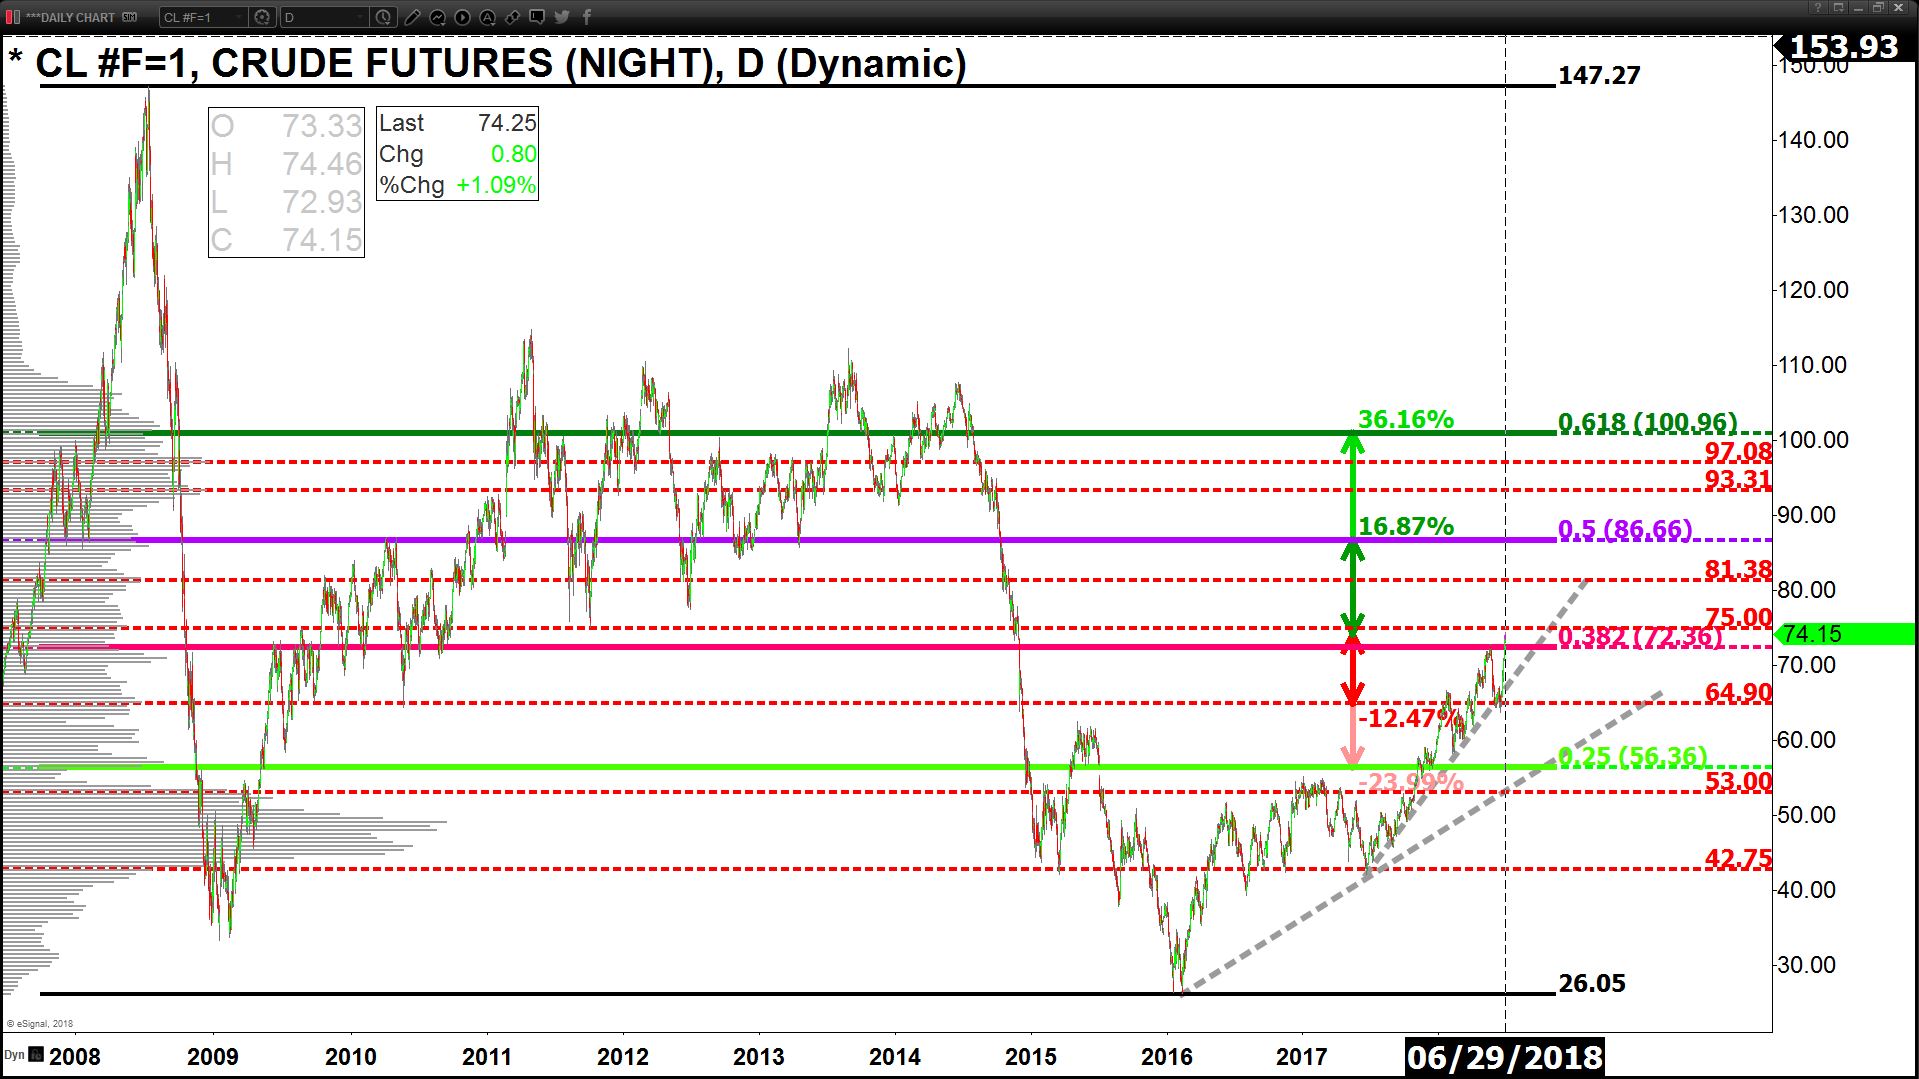
OIL: Currently on path to $75 but highly over-bought. A consolidation period is expected before the next leg higher on Oil to $86.66 (+16.9%); as speculators capitalize on the managed supply and growing demand aspects of Oil as most economic expansions globally start peaking.
To learn more about investing and trading within the cannabis space for the back-half of 2018, join us for a complimentary 3-hour Online Workshop on July 14, 2018 (12 pm – 3 pm EDT). Click here to reserve your seat.


