

So, I’m not bearish at this point. I’m just trading. But anyone who recalls 2007-2008 will remember that the KBW Bank Index (BKX) was in well-established down trend for months before the rest of the market joined it in earnest, writes Dr. Joe Duarte Sunday.
Behavior is an interesting thing. People develop habits. And those who observe them and interact with them develop a sense of security from the general predictability of the patterns of their interactions. So, after a while, marriages become comfortable, business interactions become mostly automatic, and market analysis tends to fall into a predictable groove.
Until, of course, things change.
A funny thing happened to me at the bank last week. As I went in for a routine lunch time deposit, the place which is usually packed at that hour was deserted. As I made my deposit, the usually “all business” teller started chatting me up. In fact, she asked me if I needed a home equity loan, a new CD or even a line of credit. When I politely declined, she seemed to be at a loss for words. In fact, for a flicker in time, I sensed a bit of anxiety in her demeanor.
That was the first time I had experienced such as thing since the depths of the old subprime mortgage crisis days when panic was the modus operandi for bank tellers and executives. So, I had a look at the banking stock index and what I found was troubling to say the least.
As the chart below clearly shows, the venerable KBW Bank Index (BKX) is tracing a lower low, lower high trading pattern. Even more concerning is the fact that this bearish trading pattern is now possibly on the verge of starting what could be a new and perhaps decisive down leg.
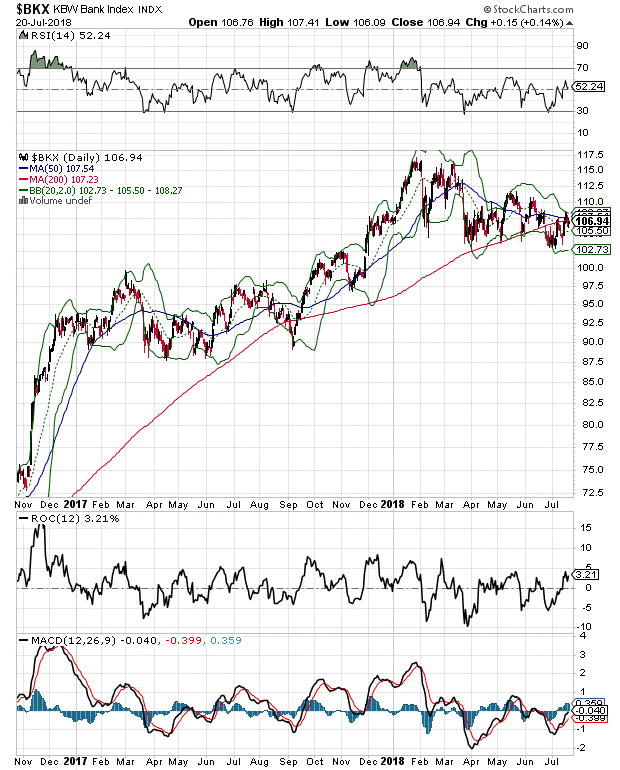
I base this final conclusion on the fact that BKX has failed in its latest bid to rise above its 200-day moving average and that all the technical indicators corresponding the current price trend in the index are also flashing caution.
Of course, things could change. But if they don’t we could be in the early stages of something completely different than what we’ve seen since the election of Donald Trump.
Stocks look ready for a pause
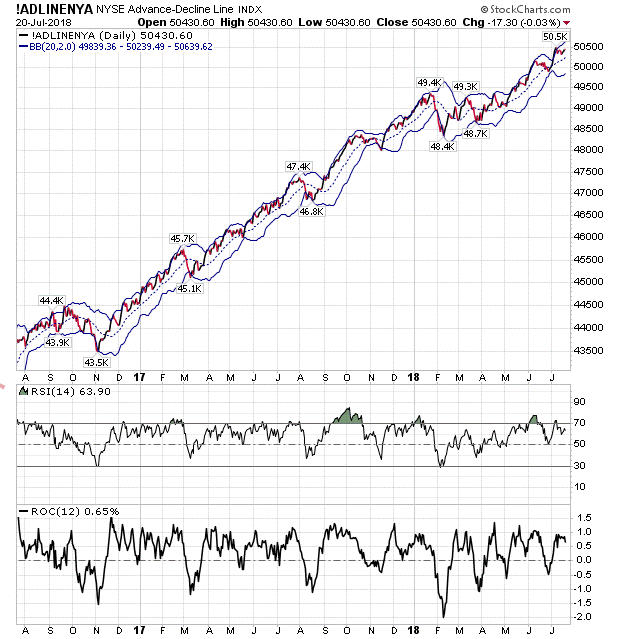
The New York Stock Exchange Advance Decline line (NYAD) is still within striking distance of making a new high. And given the fact that this indicator has been nearly 100 percent reliable since the 2016 presidential election in predicting the trend for the stock market, we have to consider that the trend, at this point and until proven otherwise remains to the up side.
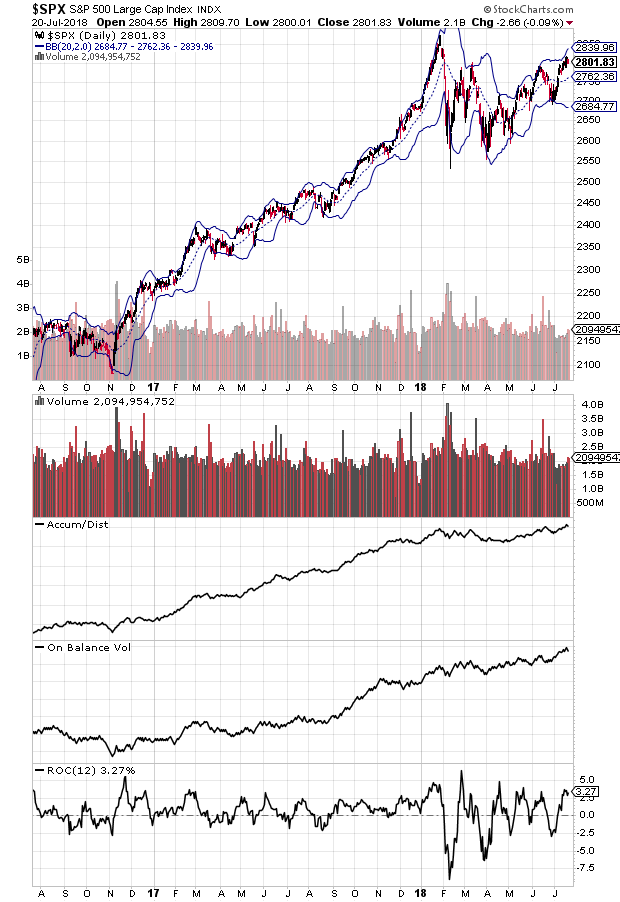
Nevertheless, even though it may be a fleeting thing, I don’t like the rising volume on down days that I’m seeing on the S&P 500 (SPX) and the Nasdaq 100 (NDX) indexes.
Pay special attention to the rising volume registered on Friday’s generally flat trading in NDX and SPX while breath was slightly negative on the NYAD.
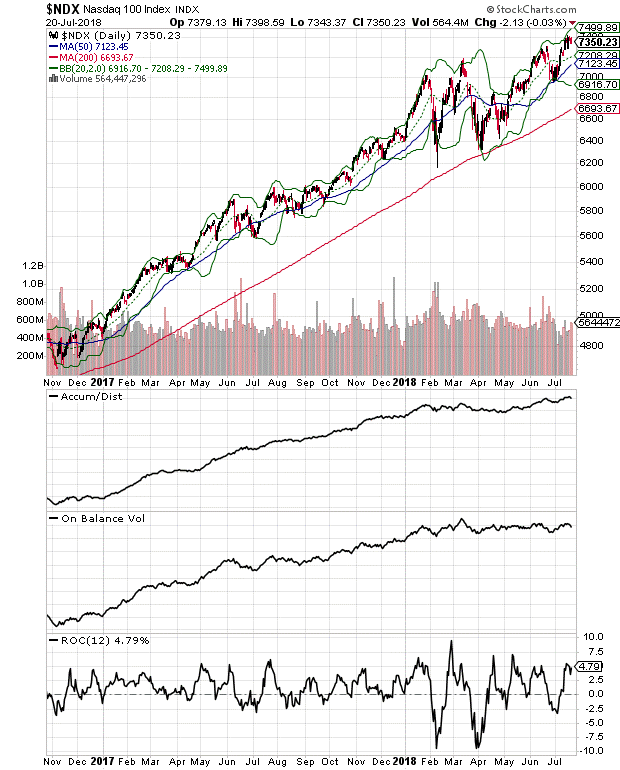
I especially didn’t like what I saw on July 20th where selling volume picked up fairly briskly as the day went on. This one particular volume event contributed to last week’s general softening of both the Accumulation Distribution (ADI) and On Balance Volume (OBV) indicators on both NDX and SPX. What concerns me is that together, the general trend in NYAD, paired with the OBV and ADI indicators for these two indices have been excellent predictors of the general trend in the market. The fact that all three are now flattening out simultaneously suggests that the market is starting to synchronize its behavior and may be ready for a change in the long-term up trend.
Are the bots changing the game?
We may be witnessing a change in the programming for trading algorithms. And if that is indeed happening, this market may be headed for some trouble.
As I’ve said before, we remain in a bull market. Yet, some eerie comparisons to that venerable pre-2007-2008 market crash period of time are increasingly evident.
nd even though this time may be different, it is still concerning to see that just as in 2007-2008, bank stocks are struggling, and perhaps are on their way down for a good period of time while tech stocks and the rest of the market, especially the NYSE Advance Decline Line, the Nasdaq 100 Index and the S&P 500 are still within striking distance of new highs. In other words, we may be seeing the first stealth raid by the bears starting to materialize.
So, I’m not bearish at this point. I’m just trading. But anyone who recalls 2007-2008 will remember that BKX was in well-established down trend for months before the rest of the market joined it in earnest. Therefore, unless things change, I am suggesting that it is plausible to consider the notion that something different may be emerging from the digital brains of Wall Street’s Algo Machine.
Joe Duarte is an active trader and author of Trading Options for Dummies, now in its third edition and The Everything Investing in your 20s and 30s. To receive Joe’s exclusive stock, option, and ETF recommendations, including trade results, visit www.joeduarteinthemoneyoptions.com.


