

Focus on the economic facts. The economy is growing; unemployment is at record lows; wages are growing at strong rates; companies are unable to fill jobs. In the last earnings cycle, more S&P companies beat analyst earnings estimates in years, writes Dr. Kerry Given.
The overall markets were down last week, with the S&P 500 Index (SPX) closing Friday at 2914, down 16 points from the previous week’s close. Should we be concerned? There are certainly plenty of doomsayers on the sidelines who cry loudly each time the market falters even a bit. I think they have cried wolf too many times.
<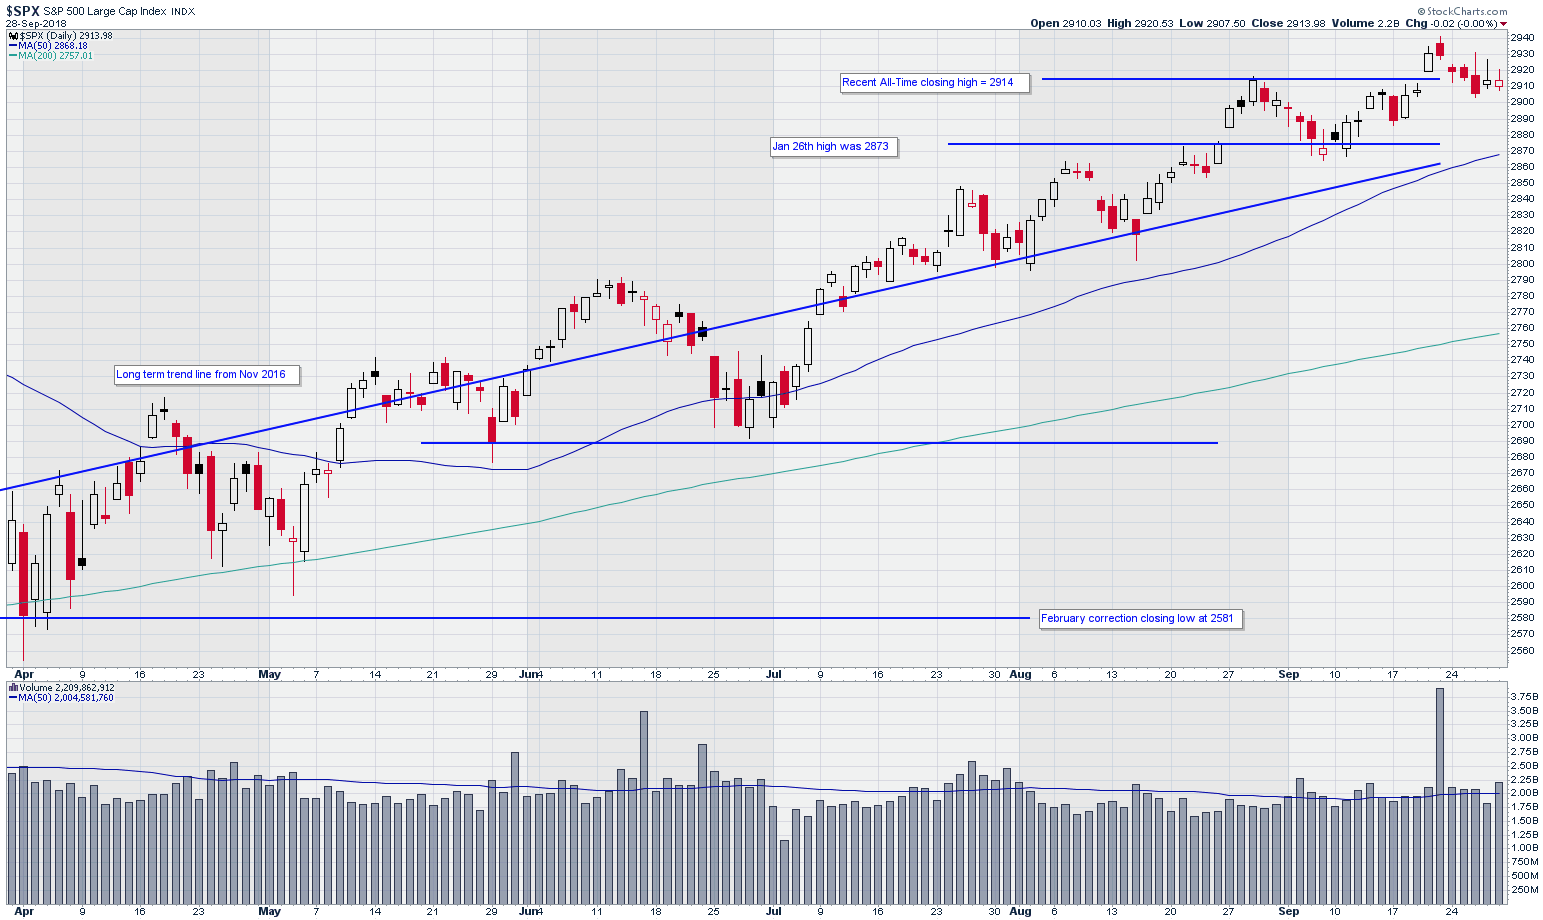
Standard and Poor’s 500 Index (SPX)
Chart courtesy of StockCharts.com
Friday’s close was precisely at the all-time high logged by SPX on September 20 and remains well above the previous high at 2873 from January 26. Therefore, it is much too early to speculate on any trend change, especially just after posting a GDP growth rate of 4.2%. Even if we figuratively back up and draw a trendline on SPX for the past two to three months, it is unquestionably strong and continuing to grow.
The non-stop tirade about trade tariffs continues, but the markets just keep trading higher.
Trading volume for the S&P 500 last week was near the 50-day moving average (DMA) most of the week, and moved a bit higher on Friday. In general, trading volumes remain lackluster. It suggests that many traders are just letting their positions run and leaving any additional cash on the sideline.
Market volatility, as measured by the S&P 500 volatility index (VIX) wandered sideways last week, reaching intraday lows and highs of 11.6% to 13.2%, but closing Friday at 12.1%. This VIX trend, together with low to average trading volume, suggests relative calm among the large market participants.
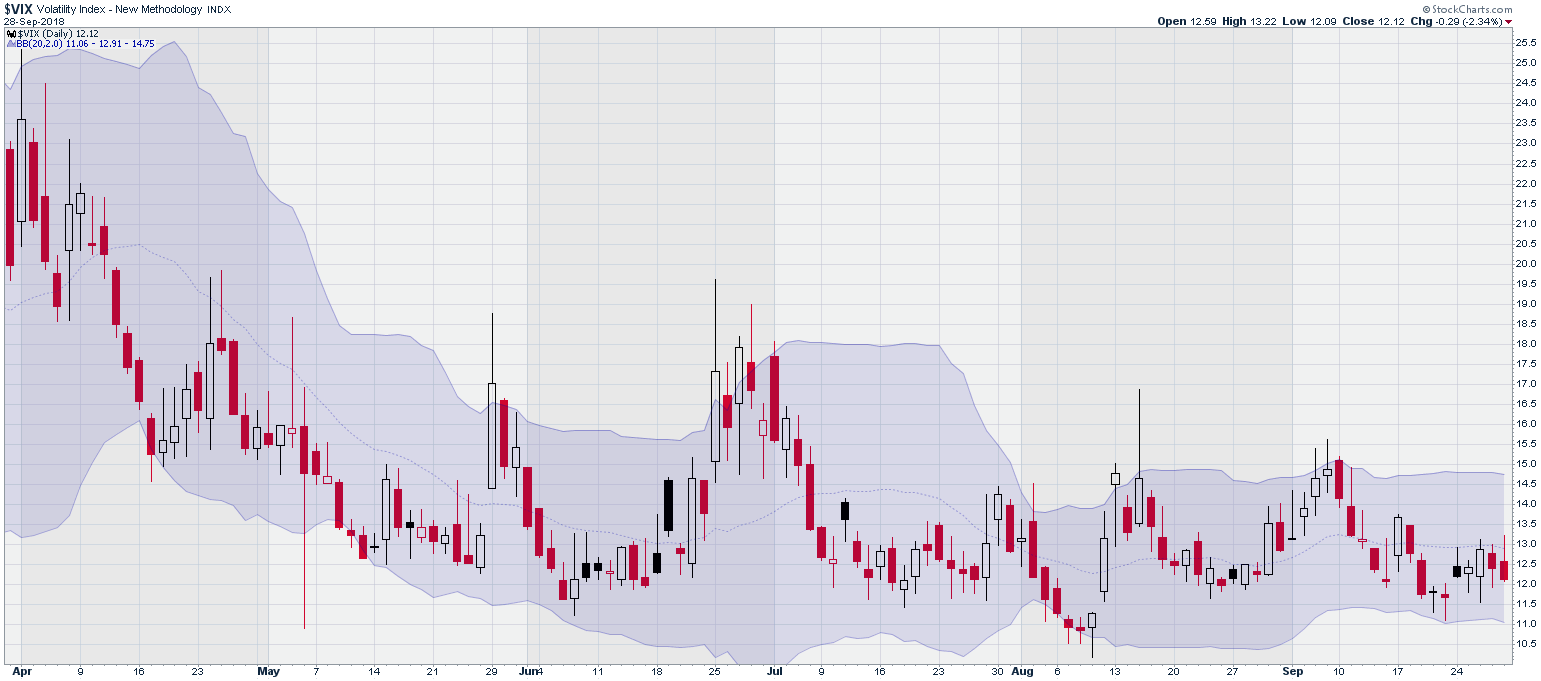
CBOE SPX Volatility Index (VIX)
Chart courtesy of StockCharts.com
The exception to our story among broad market indices is the Russell 2000 Index (RUT) which has trended steadily lower since marking an all-time high of 1741 on August 31.
RUT broke its 50 DMA on Wednesday but posted a gain Friday.
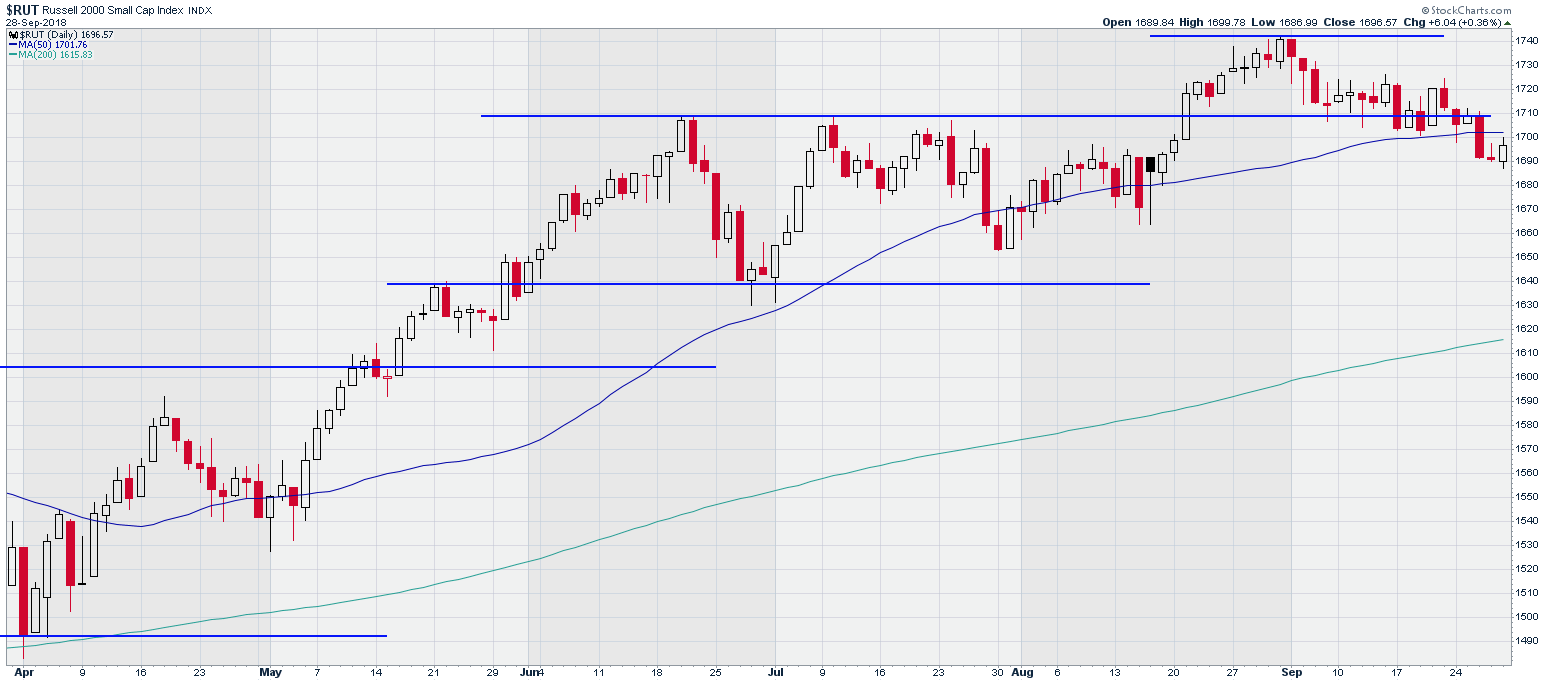
Russell 200 Index (RUT)
Chart courtesy of StockCharts.com
The NASDAQ Composite Index (IXIC) closed Friday at 8046, up over 107 points from Monday’s opening. NASDAQ’s has largely traded sideways during September, banded by the highs set at the end of August and bouncing off the 50 DMA on the lower end of the trading range.
Friday’s close is only 64 points or 0.8% off the all-time high on August 31. Trading volume in the NASDAQ stocks was well above the 50 DMA all week except Thursday.
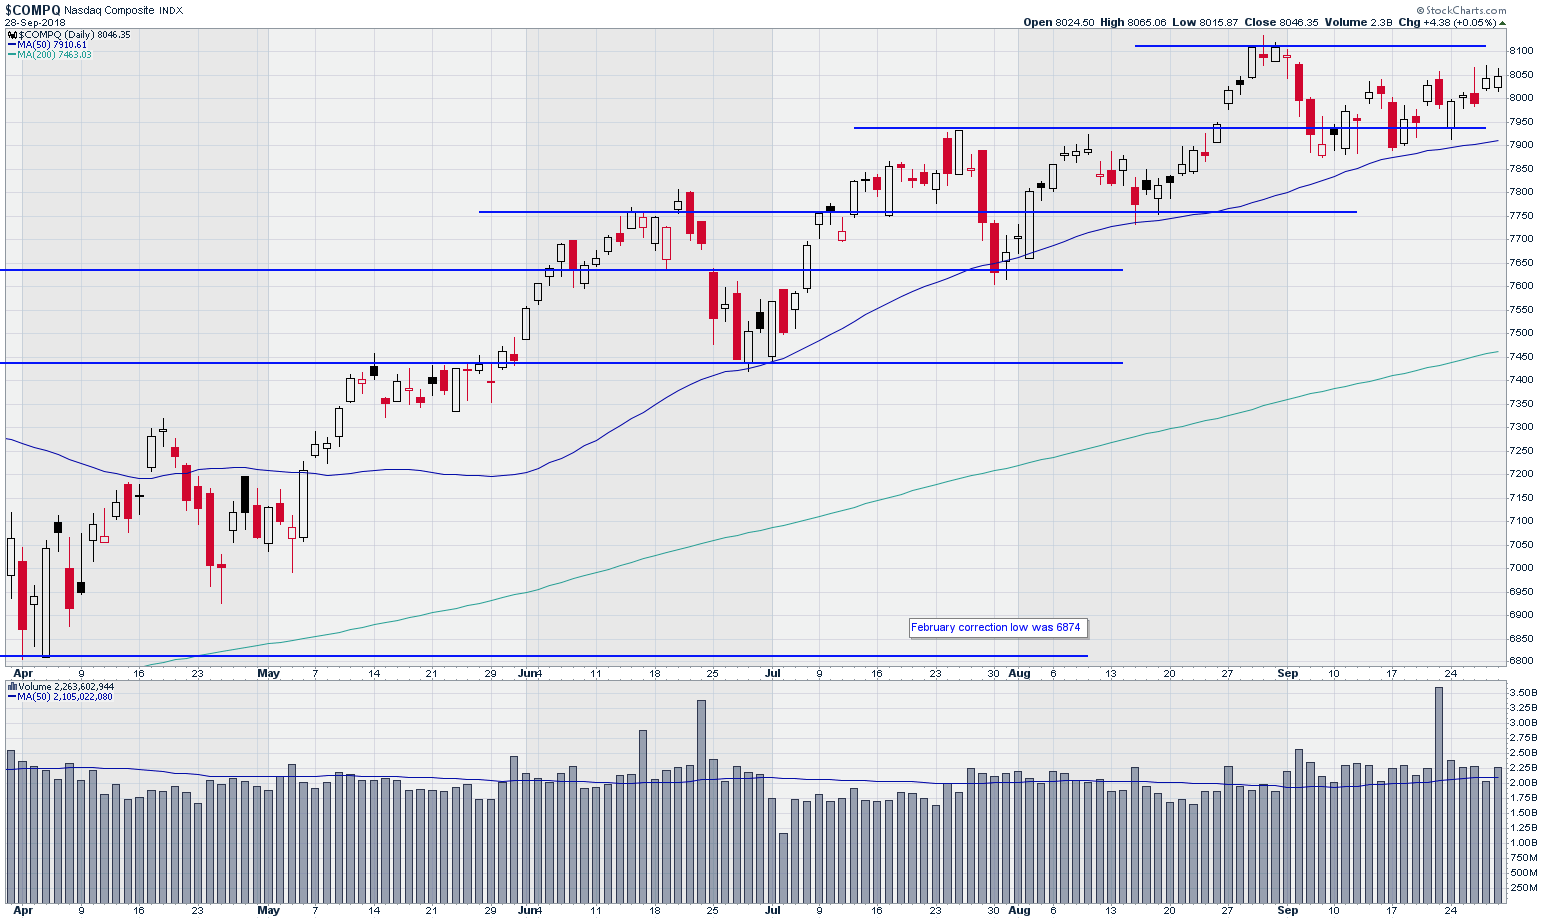
NASDAQ Composite Index
Chart courtesy of StockCharts.com
With the title of this article, I posed the question of whether last week’s downtrend is merely a healthy pause in a bull market or represents a trend change. We should remind ourselves that markets always represent a discounted future view of the market’s collective corporate cash flows.
The economic data remain very strong. When was the last time we saw a 4.2% quarterly GDP number? I don’t need to look it up. It has been a long time.
We stand at a unique point in American history. The old rule of journalists’ ensuring that their personal viewpoints were only visible on the editorial page is long gone. One of the consequences of this sea change is that my perception of the general state of the economy may be significantly distorted by a barrage of bad news and generally hateful commentary.
Focus on the economic facts. The economy is growing; unemployment is at record lows; wages are growing at strong rates; companies are complaining about being unable to fill jobs. In the last earnings cycle, more S&P companies beat analyst earnings estimates than has been the case in several years.
In spite of the weakness we saw in the broad market averages last week, that the following stocks continue to trade higher: Illumina (ILMN), Lululemon Athletica (LULU), Mastercard (MA), Visa (V), and World Wrestling Entertainment (WWE). Apple (AAPL) has rebounded and is nearing its all-time high.
However, due to the generally negative news environment I described above, this market is very volatile. Watch your positions carefully and take your gains whenever you can.
My trading group enjoyed a large gain on Nike (NKE) with a play on its earnings announcement last week. I could have almost doubled that gain by carrying the trade into this week, but I closed Friday for a 64% gain rather than hold for a gain of over 100% next week. It’s that kind of market. It doesn’t have to make sense. It just is.
Kerry Given: Options don't have to be risky video.
Recorded: MoneyShow San Francisco August 24, 2018.
Duration: 36.34.
Kerry W. Given, Ph.D.


