
The current trading pattern in the stock market has me wondering if we’re in an endless sensory loop and whether we’ve gone beyond the Twilight Zone into the Outer Limits, writes Dr. Joe Duarte Sunday.
Fans of campy 1960s sci-fi shows, such as “The Twilight Zone” and “The Outer Limits” may remember sitting on their couch, occasionally looking over their shoulders and nervously laughing as the introductions to the shows, full of intrigue and voiced over by sober sounding announcers – Rod Serling and Vic Perrin respectively – set the scene for the scary stuff that would surely follow.
Lately, I’ve been getting that same feeling of unexplained weirdness in the air, as I sit in my office chair while watching my trading screen. Moreover, I find myself looking over my shoulder and wondering if a monster is about to tap me on the back. And just when I think it’s over, it starts again when the Dow Jones Industrials rallies 500 points only to be followed by a 300 point drop the next day.
Indeed, it seems this market has gone from a somewhat manageable “dimension of trading sights and sounds,” to “there is nothing wrong with your trading screen. Do not attempt to make profitable trades. We are controlling the tape. For the next trading day sit quietly and we will control all that you see and hear.”
Everyone is connected at the universal umbilical cord being controlled by the Fed
In case you haven’t figured it out, the Federal Reserve will deliver more interest rate increases, just as it did in 2007 and 2008 in what arguably turned out to be the worst policy error of all time for all central banks. Of course, once the market crashed the Fed compounded its error by printing so much money that the world became desensitized to economic reality while markets lost touch with fundamentals and became robot algorithm playgrounds.
Flash to the present where even as the housing sector has fallen apart, and the economy is starting to show signs of slowing elsewhere, the Fed’s ongoing rate hikes are raising the risk of a colossal bear market in stocks – see the charts below. What’s worrisome is that this time is different, as in the past, most people didn’t care so much about the stock market.
But now thanks to the repealing of the Glass-Steagall Act, Wall Street and Main Street are connected by the umbilical cord built from the 401-k plan and the company stock buyback programs to the Fed’s actions. Subsequently as interest rates rise stocks will likely continue to sell off, and the always fully invested and passively managed 401-k plans will start to lose their value, just as companies slow or stop buying back their stock in the market.
Eventually, as human investors further stay away from stocks, liquidity will dry up and the whole thing will likely cave in, as the pink slips fly and the reality of the moment sinks in on Main Street.
Market Breadth Runs Into Brick Wall
The NYSE Advance Decline line (NYAD) has been the best of all technical indicators since the 2016 presidential election, which is why its current posture is very disturbing. Specifically, after the recent correction, the NYAD is struggling to regroup and form some sort of upward trend, a sign that the market is having liquidity problems.
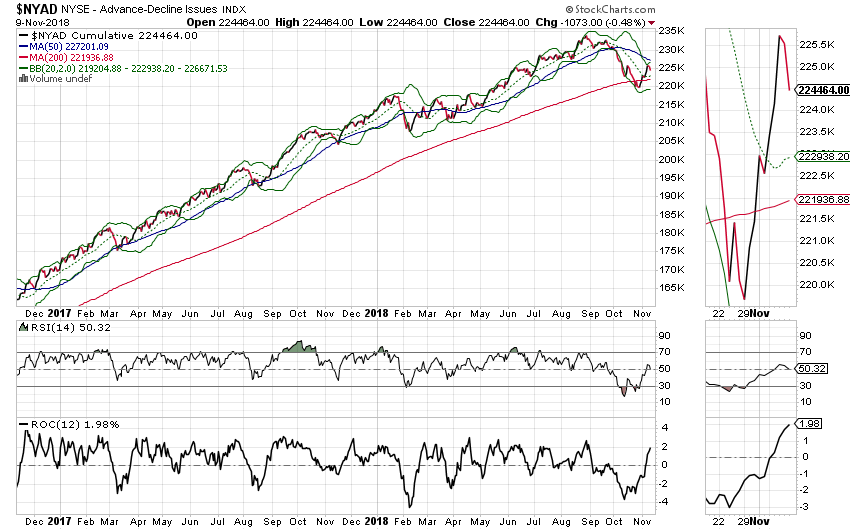
Simply stated, the two-year uptrend in NYAD has been broken and there doesn’t seem to be enough money moving into stocks at the moment to move the NYAD above its 50-day moving average, which is the current key resistance level. Thus, a decisive break below the 200-day moving average, the current key support level, would likely signal much worse trouble ahead for the stock market.
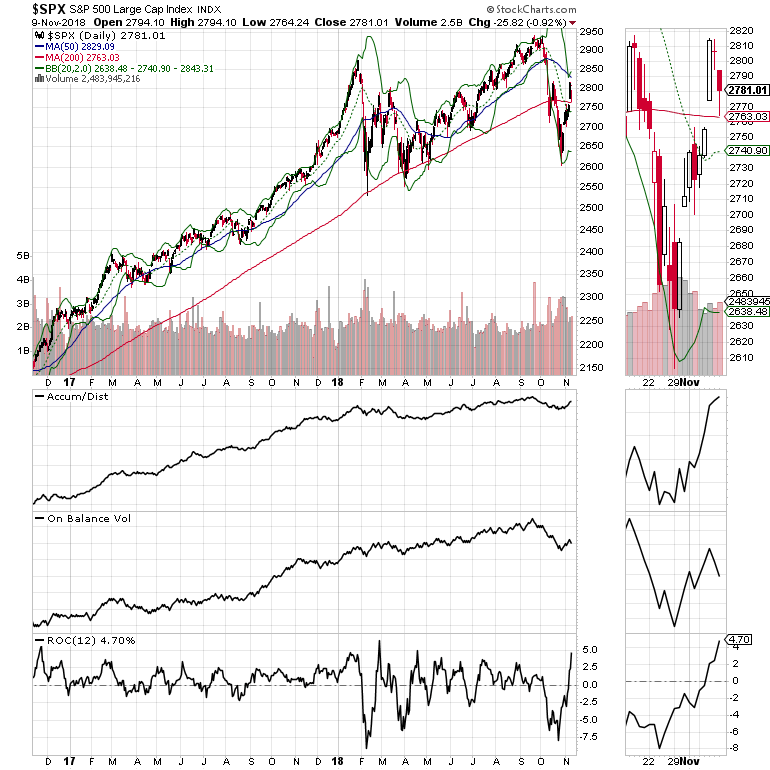
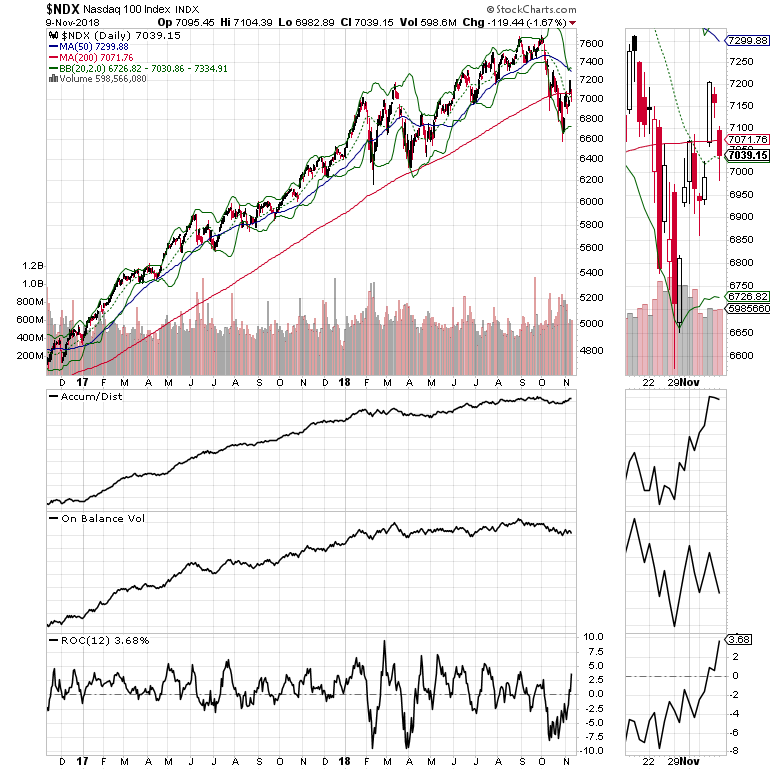
A similar trading pattern is visible in both the S&P 500 (SPX) and the Nasdaq 100 (NDX) indexes, which are also struggling to turn the trend back to the up side even though there has been a fairly credible bounce in the Accumulation Distribution (ADI) indicator for both indexes. Unfortunately, the slightly bullish case falls apart, as On Balance Volume (OBV) which is worse for NDX and seemingly worsening for SPX are heading lower.
Even worse is the fact that NDX is perilously close now to a major break of its 200-day moving average which may be a prelude of worse things to come in the technology sector.
Moreover, the relationship between rising interest rates and falling stocks has never been clearer.
The chart of the U.S. Ten Year bond yield (TNX) shows that market interest rates have risen significantly in the past 12 months. And while stocks managed to continue their rise for most of that period, once yields crossed above 3.10% convincingly, all bets were off.
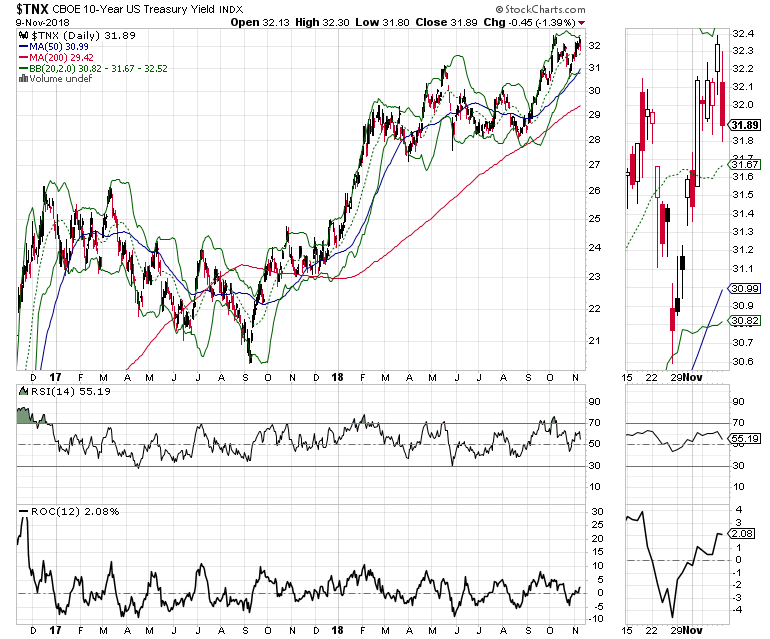
But here is the fly in the ointment. TNX is struggling to rise above the 3.25% yield even as the Fed is talking about higher rates. This suggests that bond traders are thinking that the odds of a recession are rising - a factor that would further complicate matters for the stock market if it comes to pass.
Worsening of liquidity crisis may be just around the corner
Market declines result from two separate processes. One is that stocks become too expensive to warrant risking capital in their ownership. The other is that once stocks become expensive people stop buying them. The resulting fall in money flowing into the market eventually becomes a liquidity trap as there is not enough money floating around looking for stocks to buy.
Making matters worse, higher interest rates compete with money flows into stocks. After all, why would anyone risk losing money in expensive stocks when they can make money, or not lose money in a money market fund which pays interest? When enough people realize this particular situation is the dominant factor in the market, then the liquidity trap worsens and stock fall aggressively.
It looks to me as if we are now well into this scenario which may worsen quickly if we are entering a recession and the Fed fails to stop raising rates. No matter what, with the Fed and the bond market seeming to disagree and the stock market looking weaker by the day, we may be headed for the Outer Limits. Thus, holding well above average cash and considering trading on the short side in stocks is the most likely way to survive what lies ahead.
Joe Duarte is an active trader and author of Trading Options for Dummies , now in its third edition and The Everything Investing in your 20s and 30s. To receive Joe’s exclusive stock, option, and ETF recommendations, including trade results, visit www.joeduarteinthemoneyoptions.com.


