The Emini has sold off over the past two weeks from a double top bear flag on the daily chart. It’s near the October 29 neck line of the double top. After falling a bit more to support, it will probably reverse up for a few weeks from there or around the February low.
There is a 30% chance that the selloff will continue down the 10-year bull trend line at around 2350.
The crude oil futures market is in a strong bear trend. There were extreme sell climaxes a week ago week and two weeks before, and the selloff is testing the $50 Big Round Number. The bulls have a 60% chance of a reversal up to the top of the most recent sell climax high, which is Friday’s high, within a couple of weeks. The market will then probably enter a $5 – $10 trading range over the following month.
The EUR/USD forex market is trying to reverse up from a wedge bottom on the daily chart and a wedge bull flag on the weekly chart. But, the nine-week bear channel on the weekly chart is tight. Therefore, the bulls will probably need a micro double bottom within two weeks before they can get a swing up to the October 16 high. Otherwise, the next support is 1.10.
Crude oil futures market: Crashing in a series of sell climaxes, which should soon lead to exhausted bears.
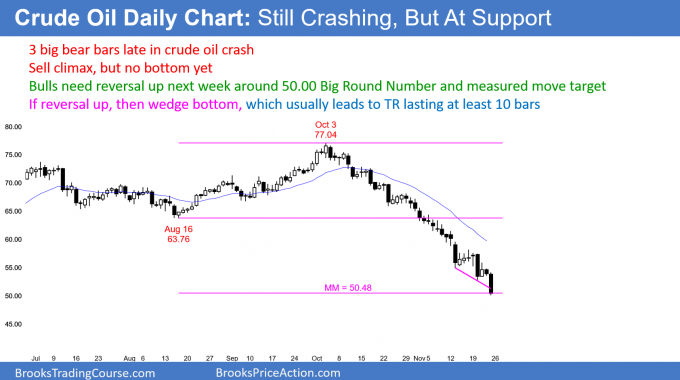
The daily crude oil futures candlestick chart has had three unusually big bear bars over the past two weeks. These are sell climax bars and they are forming late in a bear trend. Exhaustive sell climaxes typically lead to a trading range.
I wrote last week that the November 13 big bear trend bar had a 60% chance of either being the low of the sell climax or that there would be one more sell climax, and then a reversal. Tuesday last week was another big bear bar and therefore a second consecutive sell climax. Friday was a third.
Nothing has changed other than the bottom now will probably be a wedge. There is a 60% chance that Friday will be a temporary end of the selling, whether or not there is a small dip below its low this coming week of Nov. 26. Since the high of the final sell climax is the first target and Friday’s range was about $4, traders will look for the first reversal up to be at least $4.
A reversal up from a wedge bottom will typically reach the top of the wedge. That is the November 16 high just above $58. The chart then evolves into a trading range. Here, it will probably be about $8 – $10 tall.
$50 Big Round Number is a magnet
The bears are trying to drive the market down to the $50 Big Round Number. They got to within 15 cents on Friday and they will probably try again early this week.
However, the extreme sell climaxes and wedge bottom make a reversal up from around that level likely. Once the bears decide they cannot push the price down any further, they will buy back their very profitable shorts in a panic. They understand the risk of a sharp short covering rally and do not want to give back their windfall profits. The bulls will see the short covering rally and they will buy as well. This results in the sharp reversals that come from sell climaxes.
Sell climax usually evolves into trading range
After a sell climax, the rally usually also gets to the 20-day EMA. Sell climaxes lead to profit taking by the bears who now have surprisingly big profits. They know that there will be a reversal up that will last longer and go higher than what might seem likely.
Once the bears take profits, they will not look to sell again within a few days. They typically wait for 10 or more days and at least 2 legs sideways to up. They want to be certain that there will not be a major reversal up to around the 50% retracement level. That is currently $65.
The rally will probably stall at around the EMA and the wedge high at $68. At that point, the bears will sell again. However, they probably will switch to taking quick profits. The result will be a bounce from the bottom half of the developing trading range. At that point, the trading range will be clear.
The bulls are looking to buy for a $4 bounce to Friday’s high and then an $8 – $10 rally to the top of the wedge. With both the bulls and bears buying low, selling high, and taking quick profits, the strong bear trend will probably begin to evolve into a trading range this week. It will likely last for at least the next several weeks.
EUR/USD forex weekly candlestick chart: Tight bear channel after double top bear flag.
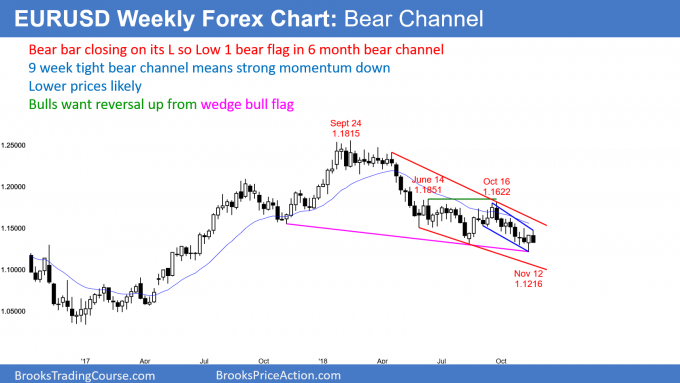
There is a nine-week tight bear channel nested within a six-month bear channel. The bulls needed a strong bull bar this week for a possible yearlong wedge bull flag, but so far have failed.
The EUR/USD weekly forex chart reversed up two weeks ago from a yearlong wedge bull flag. It was also a test of the top of the 2015 – 2016 trading range (not shown). I said last week that there were two problems with the reversal. First, while the buy signal bar was good, it was big. That means that traders had to risk more than they would like. Many instead would wait to buy a pullback so that they could use a tighter stop.
Second, the eight-week selloff was in a tight bear channel. The first reversal up from a tight bear channel is typically minor. Consequently, there is usually a pullback within the first few weeks.
Since this past week had a bear body on the weekly chart, it is a sell signal bar for next week. This week will probably trade below last week’s low and trigger the sell signal. If the bears begin to get a series of bear bars, traders will suspect that the selloff might continue down to the 1.10 Big Round Number. A measured move down from the July/September double top is around 1.08.
The bulls hoping for a wedge bottom reversal need a micro double bottom with the low of two weeks ago. With this past week closing on its low and the nine-week bear channel as tight as it is, the bulls will probably first have to stop the selling before they can get a rally. That means they will need more strong bull bars before traders will buy.
EURUSD daily forex chart pulling back from first leg up after wedge bottom
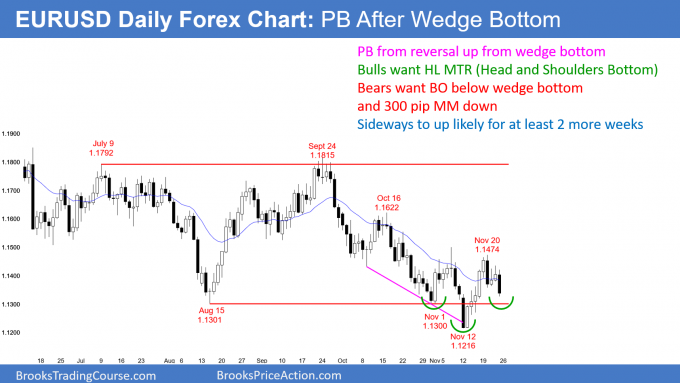
The EUR/USD daily forex chart is turning down from a three-week double top bear flag. The bulls want a higher low after their wedge bottom. That would be a head and shoulders bottom.
The daily chart reversed up for five days from a wedge bottom. But, last week’s high was a lower high. In addition, it formed a double top bear flag with the November 7 high. As long as the daily chart continues to make lower highs, it is still in a bear channel. Since the reversal up was strong, the odds are that there will be at least a small second leg up in the coming week. If the chart forms a higher low this week, there will be a head and shoulders bottom.
However, if the bears get 3 or more consecutive bear days this week, they will probably get a test the November 12 low. That would be more bearish and increase the chance of a successful breakout to a a new low and another leg down.
The bulls need to begin to break above lower highs to end the two-month bear trend. Next, they need to begin to form a series of higher lows. That would signal the start of a bull trend.
Even if the bulls are successful, the bear channel that began with the October 16 lower high will probably convert into a trading range before the bulls can form a bull trend and test the 1.18 top of the six-month trading range.
The bears hope that the two-week reversal up is just a pullback from the breakout below the November 1 low. However, they should not have allowed the strong five-day rally. Consequently, they will probably need at least a micro double top with last week’s high before they can break below the November low.
Monthly S&P 500 Emini futures candlestick chart: Emini strong Christmas rally unlikely in 2018.
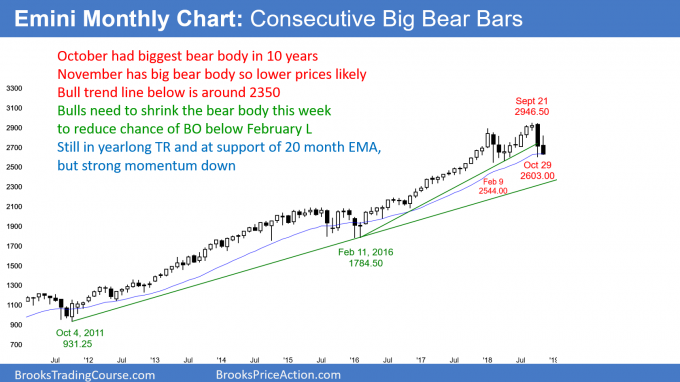
The monthly S&P 500 Emini futures candlestick chart pulled back to the 20-month EMA in October after more than 20 months above it. However, October had the biggest bear body in the entire 10-year bull trend. In addition, November so far is another big bear bar.
The monthly S&P 500 Emini futures candlestick chart has pulled back to the 20-month EMA for the first time in two years. Traders have been happy to pay an above average price for a long time. Typically, they are eager to buy at the average price once they get an opportunity.
They had their chance in late October and bought aggressively. However, while the rally was big, it did not last. That means that the traders who bought were expecting a bounce, but not a resumption of the bull trend. There were no buyers at the top of the rally. The bulls therefore are buying selloffs and not breakouts. This is a characteristic of trading ranges and bear trends, not bull trends.
If November is a bear bar on the monthly chart, the odds will favor more sideways to down trading. If it closes on its low and below the 20-month EMA, December will probably trade below November’s low.
The next major support is the 10-year bull trend line. It is currently around 2350. At the moment, the bears have a 30% chance of reaching that target.
Year-end rally to a new high is unlikely
There is always a bull case. If November closes around the open of the month, it would form a doji bar on the monthly chart. It would represent a lack of sustained selling and therefore increase the chance of a new high within 3 – 6 months.
There is a 30% chance that November will close on the high of the month. If so, it would be a good buy signal bar for December. The bulls would probably get a new high within a few months.
Double top, but minor reversal on monthly chart
The bears hope that the January/September double top is the start of a bear trend. But, those tops are only 10 bars apart. That is usually not a big enough topping pattern to lead to an opposite trend. Consequently, the two-month selloff is more likely a bear leg in a trading range.
How long can it last and how far can it fall without triggering a bear trend? Further than the bulls would like. If the bears get three consecutive bear bars, the odds will shift in favor of a second leg down after the first 1 – 3 month bounce. With only a week left in November, November will probably be the second consecutive bear bar on the monthly chart.
That means that December will be important. If the bears can create a third consecutive bear bar, the bulls will probably need a micro double bottom before they will get a new high.
For a micro double bottom to form, the bulls would need a bar to go above the high of the prior month. Sometimes the bounce lasts two bars. They would then need another 1 – 2 bar selloff. If that selloff reverses up, it would create a micro double bottom, which would be a higher probability buy setup.
What do the bears need for a bear trend?
Since there is always a chance of a bear trend, how likely is it? At the moment, the bears have a 30% chance of the current selloff leading to a bear trend on the monthly chart. That would mean a major trend reversal instead of a minor trend reversal. Therefore, there is a 70% chance of a trading range or a bull flag.
What is the definition of a bear trend?
In recent years, institutions have defined a bear trend as a 20% selloff. That is convenient because it allows for a quick categorization of selloffs. But, that is rigid and it often does not reflect what the price action is saying. A bear trend on the daily chart is often a bull flag on the monthly chart.
For example, in 1987, the S&P 500 fell more than 30% in one month. Was that a bear trend on the monthly chart? The market rallied since then and never fell below the October 1987 low. On the monthly chart, I would could it a sharp, brief pullback to the 20-month EMA and not a bear trend. It did not “trend” down. Therefore, while the news will call a 20% selloff a bear trend, I use the layman’s definition of a trend. That requires a sustained change in direction. I would like to see many bars in one direction before I would say something is sustainable and therefore trending.
For the monthly chart to be in a bear trend, there would have to be about 10 or more bars down from the high. In addition, there would have to be at least one lower low and one lower high. Consequently, the monthly chart is far from being in a bear trend. Even if it fell more than 30% like in 1987, without lower highs and lows, the selloff would still be a pullback in a bull trend.
Weekly S&P 500 Emini futures candlestick chart: Second leg down from lower high.
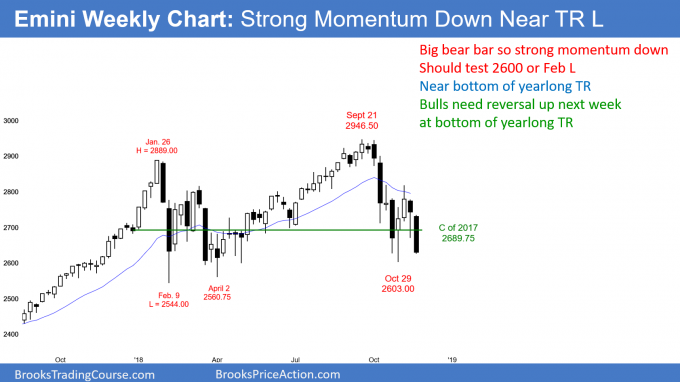
The weekly S&P 500 Emini futures candlestick chart formed a big bear bar this past week.
This is a resumption of the October selloff, and a test of the bottom of the 2018 trading range.
The weekly S&P 500 Emini futures candlestick chart sold off strongly this past week. It is near the bottom of the yearlong trading range. Trading ranges resist breaking out. Consequently, the odds are that the Emini will reverse up from around the bottom of the trading range. However, it might have to break below the February low before the reversal takes place.
This past week was a big bear bar in a strong selloff from the October high. In addition, there is room to the February 2544.00 low at the bottom of the trading range. As a result, the Emini will probably fall at least a little more over the next few weeks. Support is at the October 2603.00 low and the February 2544.00 low.
What if there is a breakout below the February low?
The bears want consecutive big bear bars closing on their lows and below the February low. If they get them, there will be a 50% chance of some kind of measured move down. Targets would be a 200-point selloff based on the height of the October rally or a 400-point selloff based on the height of the yearlong trading range.
Why only 50% chance? Whenever there is a strong breakout below obvious support, there is a 50% chance that the breakout will lead to a swing down and a 50% chance that it will fail and the Emini will reverse up. Until there is a strong buy signal bar, the odds favor sideways to down trading.
Daily S&P500 Emini futures candlestick chart: Strong selloff from double top bear flag to test October low.
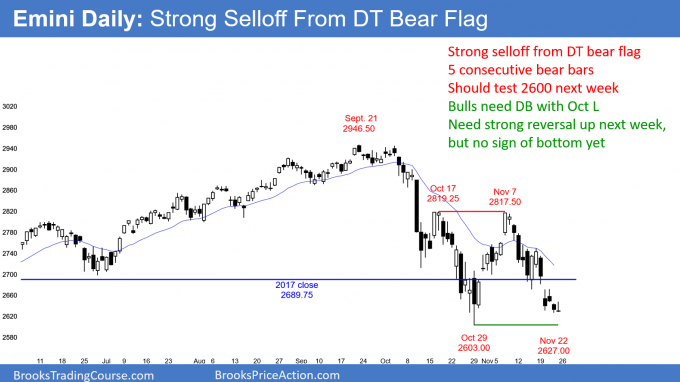
The daily S&P 500 Emini futures candlestick chart turned down from a double top bear flag two weeks ago. It has five consecutive bear bars and it is testing the October low.
The daily S&P 500 Emini futures candlestick chart turned down from a double top bear flag two weeks ago. The two tops were the highs of October 17 and November 7. A double top bear flag has a 40% chance of breaking below the neck line and falling for about a measured move down. The October 29 low is the neck line. Since the double top is 200 points tall, a measured move down is around 2400.
It is important to realize that there is a 60% chance this will not happen. Consequently, the bulls will look for a reversal up from around the obvious support of the October 29 low of 2603.00 and the February 9 low of 2544.00.
Possible triangle
The November 7 high is just below the October 17 high, and it is therefore a lower high. Last week’s low was just above the October low. A market that forms a lower high and a higher low is trying to form a triangle.
A reversal up on Monday would create a micro double bottom with last Tuesday’s low. Furthermore, the bulls have a wedge bottom with the November 2, 15 and 20 lows. But neither the micro double bottom nor the wedge bottom is strong. The bulls will need several consecutive bull bars to convince traders that they will be able to create a swing up. It is more likely that this selloff will test the October low and maybe the February low.
Confusion creates trading ranges
There is no sign of a persuasive bottom yet. Traders should expect at least slightly lower prices. However, if there are consecutive big bear bars closing below the February low, the odds will shift in favor of a swing down to around 2400.
The entire year has been in a trading range. Trading ranges resist breaking out. It is therefore more likely that the Emini will reverse up within a couple of weeks than break strongly below the February low.
Since the Emini has been in a trading range for almost a year, if the bulls get a rally, it will probably stall below the November 7 high. Instead of a bull trend, there will be a 200-point trading range within the 2018 trading range. The 2018 trading range will have a double top and a double bottom. At that point, the Emini will be balanced and in breakout mode. This is the most likely outcome, and the bull leg in the trading range should begin in December.
Trading Room
Traders can see the end of the day bar-by-bar price action report by signing up for free at BrooksPriceAction.com. I talk about the detailed Emini price action real-time throughout the day in the BrooksPriceAction.com trading room. We offer a 2-day free trial.


