

Until there is a breakout, there is no breakout. Consequently, as strong as the past 5 days have been, the odds favor at least a minor lower high within the next 2 weeks, writes Dr. Al Brooks Saturday.
Monthly S&P 500 Emini futures candlestick chart:
First pullback to 20-month EMA in more than 20 months
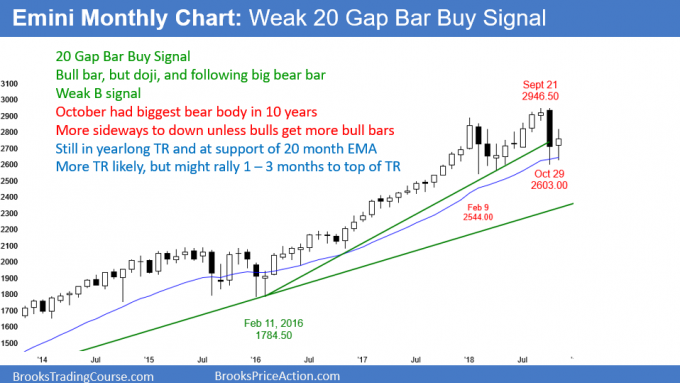
The monthly S&P 500 Emini futures candlestick chart pulled back to the 20-month EMA in October. November had a bull body and it is a buy signal bar for December. However, since it is only a small bull doji bar, it is probably not strong enough to reverse October.
The monthly S&P 500 Emini futures candlestick chart reversed up from the 20-month EMA in November. However, the candlestick was a small bull doji. That is probably not a strong enough foundation to support a sustained rally. This is especially true after the big bear bar in October.
That bar was the biggest bear bar in the 10-year bull trend. It is therefore a bear Surprise Bar. A Surprise Bar typically has at least a small second leg sideways to down. If the bulls get two more bull bars closing near their highs, that will be enough to make traders believe that the bull trend is resuming. Without that, it is more likely that the yearlong trading range will continue.
The rally after a Surprise Bar is usually a pullback in the minor bear trend reversal. Sometimes it will last 5 or more bars. But it typically fails at or below the top of the Surprise Bar. Therefore, even though the bulls have a 20 Gap Bar buy setup, the rally will probably be a bull leg in the yearlong trading range. A bull leg in a trading range usually leads to a bear leg. Consequently, traders will exit longs in the upper half of the trading range where they will begin again to look to sell.
In a trading range, traders buy low, sell high, and take quick profits. This is because they know that most trading range breakout attempts fail. They make more money by taking quick profits. Once there is a strong breakout up or down, they will resume trend trading.
Bears want a measured move down to monthly trend line around 2350
Can the bears get a measured move down to around the 10-year bull trend line? Of course, they can. However, at the moment, they only have a 40% chance of a strong break below the February low. This is because the 10-year bull trend was exceptionally strong. A strong bull trend typically needs a clear major trend reversal pattern before the bears can create a bear trend.
While the bears have a higher high in September, the trading range has lasted only about 10 bars. That is likely too small to lead to a bear trend. Consequently, even if the bears get a reversal down to below 2400, the selloff will probably simply be a deep pullback in the bull trend on the monthly chart.
Weekly S&P 500 Emini futures candlestick chart:
Micro double bottom at bottom of yearlong trading range
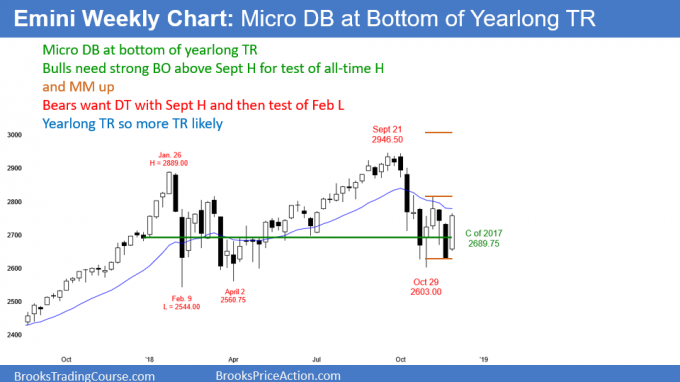
The weekly S&P 500 Emini futures candlestick chart last week ending Nov. 30 reversed last week’s selloff. This reversal is forming a micro double bottom with the low from four weeks ago. But, the bulls need a strong breakout above the high from three weeks ago. That is the neck line of the micro double bottom. Until there is a breakout, there is no breakout.
The weekly S&P 500 Emini futures candlestick chart totally reversed the previous week’s strong selloff. The two weeks therefore formed a two-bar reversal. That reversal is a micro double bottom with the low from four weeks ago. Furthermore, it is near the bottom of a yearlong trading range. However, the bulls need a strong breakout above the 20- week EMA.
In addition, the high from three weeks ago is the neck line of the micro double bottom. The bulls need either one big bull bar closing far above that high or 2 small bull bars closing above that high. If they get that, traders will believe that the double bottom will lead to a test of the all-time high.
However, the weekly chart has had many strong rallies and selloffs this year. This is typical when the chart is in a trading range. Most of these small trends reverse, even though one eventually will breakout and lead to a sustained trend. Therefore, it is better to bet that every strong move up or down will reverse than be the start of a trend.
While the micro double bottom is good for the bulls, the rally will probably simply be a bull leg in the yearlong trading range. A bull leg leads to a bear leg.
Because this past week rallied strongly and there is a micro double bottom, there will probably be follow-through buying for a 1 – 3 weeks. This is especially true because there is a bullish bias in December. However, most traders see their longs as trades, not investments. They know that the odds favor a continuation of the yearlong trading range.
What about the Fed and China?
The Fed statement this week is helpful for the bulls. In addition, if Trump wins the tariff and trade war with China, that would be bullish as well. However, a trader has to look at the charts. There is important news all yearlong. Yet, it quickly gets priced in and then traders look ahead to the next catalyst.
Yes, it would help the bulls if Trump gets a good deal with China. But, the chart is telling us that the price over the past year is just about right. Consequently, the market will tend to gravitate around the middle of the range. This is true even if there is a sharp 2 – 3 week rally from a resolution of the trade war.
Daily S&P 500 Emini futures candlestick chart:
Emini Christmas rally within yearlong trading range
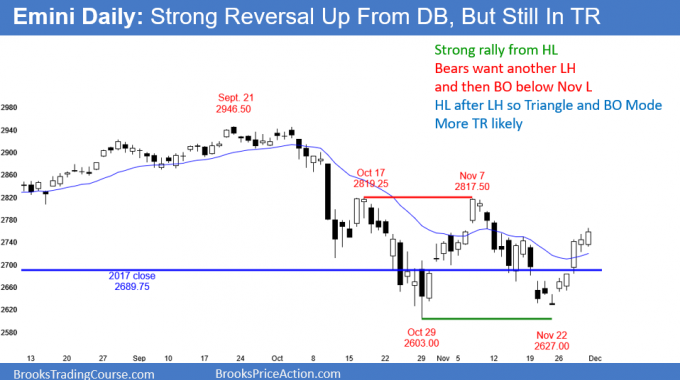
The daily S&P 500 Emini futures candlestick chart has rallied with 5 bull candlesticks from a higher low double bottom. However, there is also a lower high double top. Therefore, the daily chart is in a triangle.
The daily S&P 500 Emini futures candlestick chart has rallied for 5 days from a higher low double bottom. The rally is strong enough take make bulls buy the first 1 – 3 day reversal down. They know that a bear trend is unlikely without at least a micro double top. Therefore, the downside risk over the next few days is small.
As strong as the past 5 days have been, there is a minor problem. Look at the past year. How many times have there been 7 consecutive bull trend days? Zero. The computers know this and therefore Monday or Tuesday will probably have a bear body. As a result, the bears will look to sell a rally in the 1st half of the day, betting that the day will close below the open. But, as I said, the 1st reversal down will be minor. The bulls will probably take some profits on Monday or Tuesday and the bears will sell. Whatever pullback that results from this will be a bull flag.
The higher low last week followed a lower high in the 3-month trading range. When a trading range has a lower high and a higher low, traders will begin to look for a triangle. Whether or not a good-looking triangle forms over the next few weeks is not important. After a double top and a double bottom, traders already believe that the 2-month trading range is a breakout mode pattern. The first breakout has a 50% chance of reversing. Furthermore, there is a 50% chance that the eventual successful breakout will be up and a 50% chance it will be down.
Until there is a breakout, there is no breakout. Consequently, as strong as the past 5 days have been, the odds favor at least a minor lower high within the next 2 weeks.
Trading Room
Traders can see the end of the day bar-by-bar price action report by signing up for free at BrooksPriceAction.com. I talk about the detailed Emini price action real-time throughout the day in the BrooksPriceAction.com trading room. We offer a 2 day free trial.


