

There is no guarantee that stock prices will continue to rise. …But for now, the path of least resistance seems to be up,” writes Joe Duarte.
New wave rockers, The Cars, in their early hit: “Let the Good Times Roll,” sang about the carefree ways of the young. In a sense, the song is about going with the flow, adapting to the moment, and taking life one day at a time - “let them take you up in the air, let them brush your rock n’ roll hair.” And that roll with it attitude may be useful in this market, especially if the good times roll over in the next few days to weeks.
Arguably, and perhaps for good reason, the good times vibe is not universal. There are still plenty of investors who remain on the sidelines, living in the recent past and licking their wounds after the fourth-quarter massacre.
And there is nothing wrong with learning the lessons of history, especially the lessons of such a painful period. Yet, from a trading standpoint you can’t take this stuff personally - you’ve got to know when to let go. And until proven otherwise, it makes sense to stick with what’s working right now, which is to be long stocks in the right sectors. Currently that means owning select semiconductors (TXN, AMAT, MU), biotech, (BIB), and select international ETFs such as the IShares Brazil ETF (EWZ).
Still as we learned in October 2018, balance and prudence are the keys to success. Moreover there are some positives beyond stock prices to consider. Perhaps the most interesting development of the last week was that a key barometer of the stock market rose above a key resistance level, which — unless conditions are reversed — signals we are back in a bull market phase. Furthermore, with the Federal Reserve on hold and the Chinese central bank in easing mode, money is returning to global stock markets. Furthermore, as I mentioned last week, it would not be a big surprise if there may be a positive surprise coming from the U.S.-China trade talks.
This combination of influences makes for an interesting decision point for those investors who have been skeptical of the recent bounce in stocks and have missed the opportunity to accrue sizeable gains in a short period of time. Accordingly, given that there is so much lingering doubt about this market, and with so many having missed the rally, it seems as if it still has some upside left.
Of course, there is no guarantee that stock prices will continue to rise. And yes this rally will eventually roll over. But for now, the path of least resistance seems to be up, although the potential for daily volatility is likely to rise with earnings season moving into full swing.
But it’s more about what happens after earnings than the earnings itself as investors will start to focus on revenues and forward guidance. Moreover, since time heals all wounds, the longer the bears get whipped, the lower will be the odds of a return to the bearish trend and the higher the odds that money will continue to move into stocks at least in the near term. This is especially true given the way that robot trading algorithms accentuate the major trend of the moment, which is up.
Market Breadth Rises Above Key Resistance Line
The New York Stock Exchange Advance Decline line (NYAD) has been the most accurate indicator of the general trend in the U.S. stock market since the 2016 presidential election. It certainly and correctly predicted the decline in stocks over the fourth quarter on 2018.
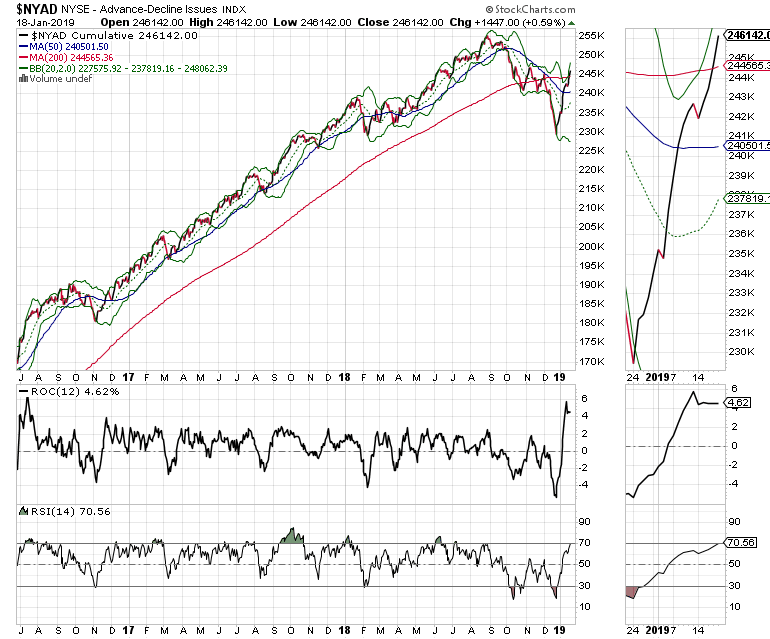
Now that NYAD crossed back above its 200-day moving average, investors should pay close attention to what happens next. If the advance decline line consolidates or moves further above this line, it would signal a sustainable return to a bull phase in the market. By the same token, a failure of this crossover to hold would likely signal that stocks are once again heading lower.
Indexes to Test Key Resistance
The NYAD has crossed above its 200-day moving average but the S&P 500 (SPX) and the Nasdaq 100 (NDX) indexes have not confirmed this event, although they are within reach of the key chart point. Furthermore, both SPX and NDX have crossed above their 20- and 50 -day moving averages, which is encouraging.
Nevertheless this sets up a conundrum for technical investors. Certainly NYAD has been the more pivotal indicator since November 2016 but at some point, it would be comforting to see the indexes confirm the uptrend.
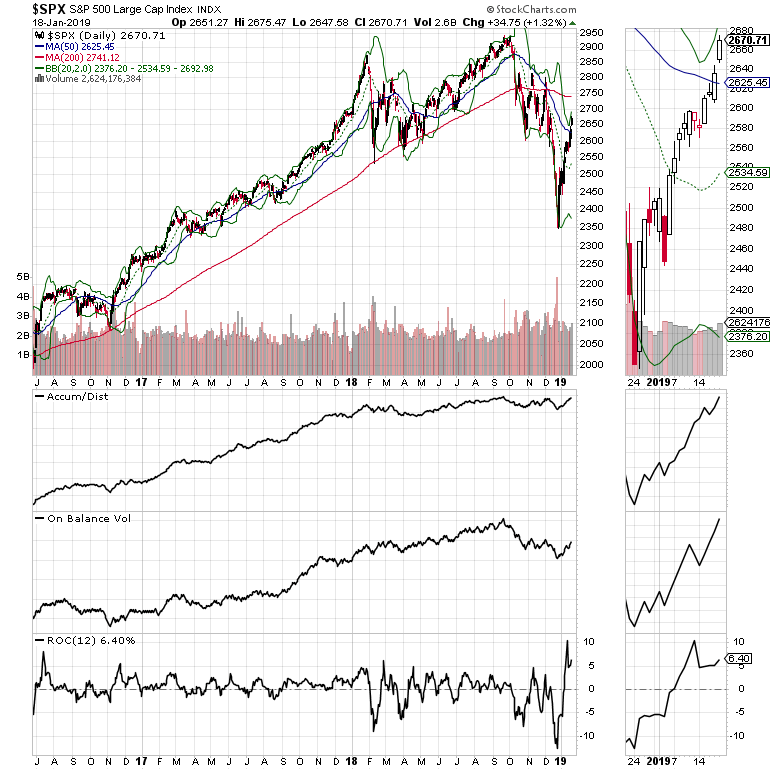
Specifically, I am focused on SPX and NDX and their 200-day moving averages because most human technicians seem to ignore this traditional dividing line between bull and bear markets, but the robots don’t. In fact a review of the SPX chart clearly shows that during the Q4 decline, the index tried to remain above this key long-term moving average three separate times. On the third attempt it failed and the selling accelerated. Thus I expect a challenge of that key resistance level before the market makes its intermediate term decision.
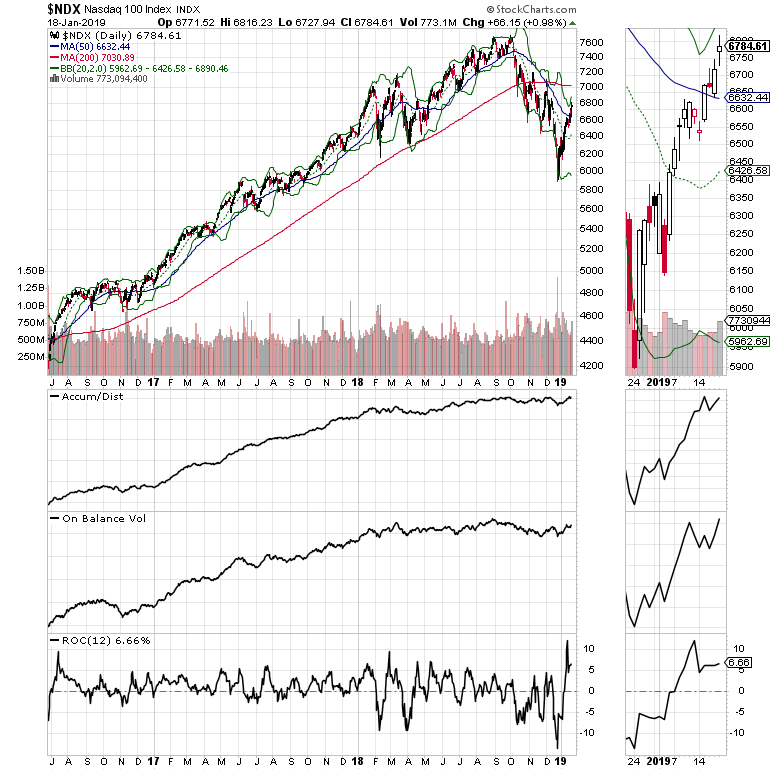
For now Accumulation Distribution (ADI) and On Balance Volume (OBV) suggest money is moving into stocks while ROC, which measures momentum suggests that we are getting close to being overbought. Altogether, this group of indicators suggests that we may have one or two more weeks left before things start getting a little dicey.
This Time Really is Different
I get it. There may be some dark clouds on the horizon. Believe me, I am not a born again bull and I don’t trust this market any more than any other market over the last 30 years. I just trade with the trend. Nevertheless, given the volatility and the speed with which prices can move I have learned that this is a much different market than the one I started trading in 1987.
Still there are some constants. One is that human nature doesn’t change –greed and fear still rule the Wall Street roost. That means that there are going to be some hedge fund managers who have missed the rally and whose clients are withdrawing money from their accounts. According to recent reports, there was $20 billion in hedge fund withdrawals in Q4. These managers are more likely than not to throw in the towel fairly soon and start buying stocks before they miss any more of the rally.
And as I noted above a review of leading price charts confirms that the technical aspects of this market are pretty good right now. Thus for hedge fund managers, there is no survival if they don’t keep up with the market, or have any customers. After all, adapting is the first stop in the road to survival.
Given the potential for surprises and unintended consequences, it still makes sense to keep a short-term time frame and to take profits sooner rather than later. As long as the market keeps rising you can protect profits by continuing to ratchet stops higher or by using price targets to move money to the sidelines. At the end of the day, 2% in money markets is not a bad return for taking almost zero risk while you wait for the next trading opportunity.
In the end, we may be at one of those evolutionary crossroads in the markets. Indeed investors who refuse to adapt to the new reality: volatility, robot traders being in control, getting used to smaller profits and trading with short-term time frames, life is going to be very difficult.
I own AMAT, MU, and biotech stocks EWZ as of this writing.


