

Equity markets are at a crossroads with various conflicting signals reports Matthew Timpane, senior market strategist for Schaeffer's Investment Research.
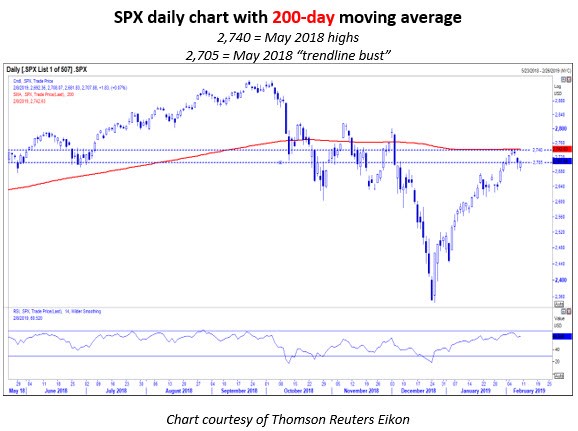
Equity bears jumped on last Thursday's news that a trade deal with China was doubtful before the March 1 deadline, with the White House later confirming that it would be highly unlikely that President Donald Trump and President Xi Jinping could meet to hammer out the final details before the deadline. The news happened to coincide with the S&P 500 Index (SPX) being within striking distance of its 200-day moving average just a day earlier and, ironically, the May 2018 highs after its breakout earlier that month. I suspect these technical levels only added to the selling pressure, as many technicians were likely already shorting against this resistance.
Therefore, while traders had been riding the tailwinds from the 2019 Fed decision to be patient with rate hikes, the other tailwind of a potential China trade deal has now become a temporary headwind as negotiations appear to still have a "sizeable distance" to go, according to National Economic Council Director Larry Kudlow. Furthermore, another government shutdown is looming on Friday, Feb. 15, which already had many market participants on edge, as there seems to be little bipartisan compromise on President Trump's demands to include funding for the southern border wall.
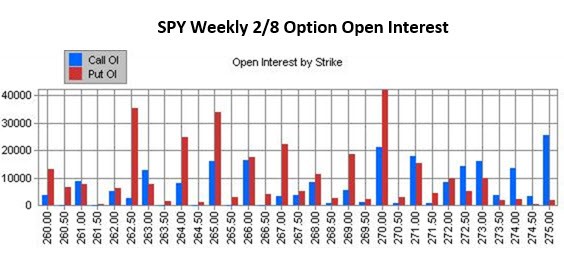
However, on Friday, just minutes away from the first negative weekly close of the year in the S&P 500, the bulls pulled off a last-minute rally to push the index fractionally higher. Not surprisingly, the 270-strike put on the SPDR S&P 500 ETF Trust (SPY) weekly 2/8 contracts happened to be the largest area of open interest, and subsequently, more than 40,000 contracts ended up expiring worthless due to the last-hour rally.
In addition to the SPX running into overhead resistance near the 200-day moving average, the Nasdaq Composite (IXIC) also neared resistance at its 200-day moving average. Consequently, market participants shouldn't have been surprised by last week's price action, with multiple market indices due for a pullback and the Relative Strength Index (RSI) on the SPX and IXIC daily charts approaching overbought levels.
Meanwhile, market breadth also found an area of resistance that is typical of markets rebounding from correction territory. Last Wednesday, around 50% of the S&P 500 stocks had crossed above their respective 200-day moving averages, which is an area where various rallies from correction territories have historically stalled, as we can see referenced in the chart below. While this indicator doesn't tell us if we are only pausing before a further advance, if we're going to retest lows — or see new lows — it will give market participants a reason to remain hesitant until we see directional confirmation.
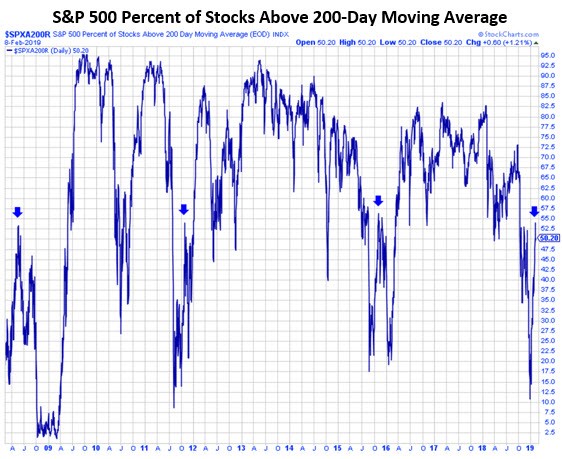
Chart courtesy of Stockcharts.com
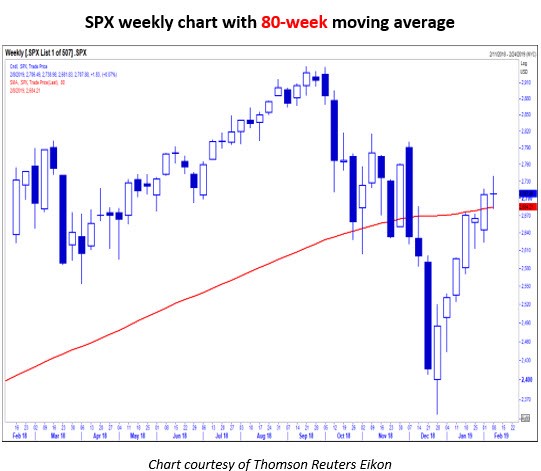
As previously mentioned the SPX closed fractionally positive for the week, which gave us a doji candlestick on the weekly chart, after trading down and bouncing off its 80-week moving average at 2,684.21. Subsequently, the last-minute rally also mentioned earlier managed to regain the May 2018 breakout area that connected the January and March 2018 highs. This market action only further confirms that traders are in an area of indecisiveness.
Other sentiment indicators continue to corroborate last week's behavior, as the American Association of Individual Investors (AAII) survey data shows that many participants remain apprehensive, with an elevated neutral sentiment reading at 37.3%, which is above its historical average of 31.4%. Meanwhile, the 10-day equity-only, buy-to-open put/call volume ratio on the SPY, Invesco QQQ Trust (QQQ), and iShares Russell 2000 ETF (IWM) is still rolling over from highs, evidence that pessimism continues to unwind, but far from levels that indicate full-fledged optimism.


