

Bears continue to miss their technical opportunities, making a test of all-time high more likely, notes Al Brooks.
The E-mini gapped above the 2900 resistance level last week. Traders will want to see follow-through buying this week. If they get it, they will expect a new all-time high within a month. The bears want a reversal down from a wedge rally to resistance.
The monthly S&P 500 E-mini futures chart has a fourth consecutive bull trend bar so far this month (see chart). After three months with shrinking bodies, April’s body is currently bigger than March’s. This is a sign that the bulls are regaining momentum. If the month closes near its high, May will probably test the 2956.00 all-time high.
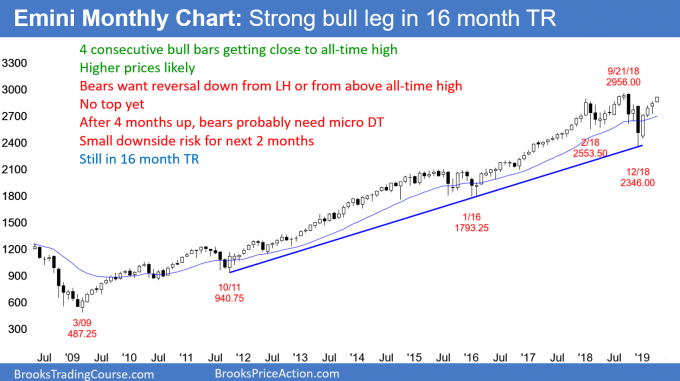
Less likely, the E-mini could sell off in the second half of April. If April closes with a bear body, it would be a sell signal bar for May. The bears would see the four-month rally as a lower high major trend reversal. It would also be a head and shoulders top.
Even if April closes on its low, the odds would still favor only a minor pullback. It could last a couple months. Traders would probably buy below the April low, expecting a quick resumption back up to the September all-time high.
The weekly S&P 500 E-mini chart triggered a credible sell signal three weeks ago (see chart). But last week closed above the sell signal bar’s high. In addition, it was the second consecutive bull bar closing near its high. And now this week also closed near its high. This strong breakout and follow-through make higher prices likely. Consequently, even if the E-mini reverses down for a week or two, the bulls will probably buy the selloff.
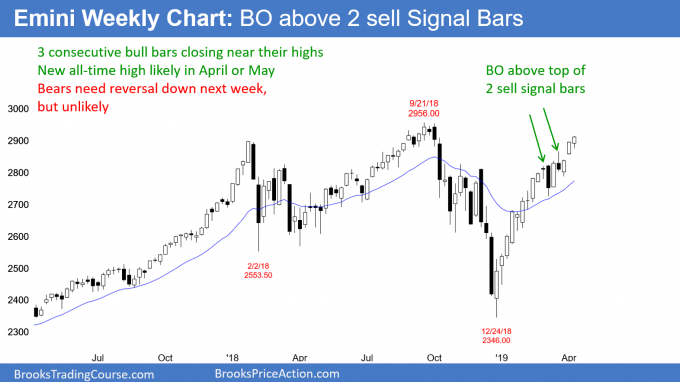
Whenever there is a breakout, there is at least a 40% chance it will fail. It sometimes reverses abruptly. More often, the bears need at least a micro double top. Consequently, even if the E-mini sells off for a couple of weeks, the bulls will likely buy it.
A reversal down less often comes without a micro double top. When it does, the bears want to see strong evidence that the bulls have given up. That can come from a surprisingly big bear bar, or three or more consecutive smaller bear bars. At that point, the bears would begin to sell, looking for at least a small second leg down.
The daily S&P 500 E-mini chart gapped up on Friday above the 2900 resistance level (see chart). It is in its third leg up over the past month. The first two legs were the March 4 and March 21 highs. A reversal down this week would therefore be from a wedge top.
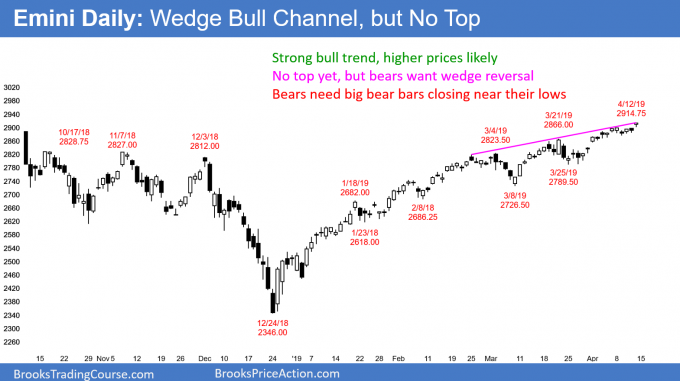
However, the bull channel over the past three weeks is tight. And so is the entire four-month bull channel. When that is the case, the first reversal down is typically minor. A strong bull trend usually has to transition into a trading range before it can reverse into a bear trend.
What about those wedge tops?
A strong bull trend is constantly forming wedge tops. But my 80% rule on inertia says that 80% of trend reversal attempts fail. Therefore, betting on a wedge reversal is a low probability bet unless there are other factors.
Sometimes the wedge can have decent selling pressure, like big pullbacks after the first two legs. That increases the chance of a reversal. That is not the case with the current rally.
The rally of the past three weeks has been especially strong. It is therefore climactic. A buy climax can go very far up before the bulls get exhausted and take profits. However, traders should always be thinking of both a plausible bull and bear argument.
The argument for the bears is that there are now three pushes up. They want the breakout above 2900 to fail and reverse down from a wedge top. For them, Friday was not a big bull trend bar. It is therefore a sell signal bar for Monday.
Since it was not a big bear bar, it is a weak sell signal. They know that they only have a 40% chance of a reversal down this coming week. But they will sell if the E-mini starts to drop.
Possible island top
If the E-mini gaps down this week, it will form an island top with Friday’s gap up. Island tops and bottoms are common and are minor reversals. Consequently, an island top next week is no more likely to lead to a bear trend than any other type of reversal.
The key for the bears is not an island top, but rather a strong reversal down. They need to start to create bear bars. They especially need some combination of bear bars closing below their midpoints, consecutive bear bars, and big bear bars. Without that, the odds continue to favor a test of the all-time high.
Trading Room
Traders can see the end of the day bar-by-bar price action report by signing up for free at BrooksPriceAction.com. I talk about the detailed E-mini price action real-time throughout the day in the BrooksPriceAction.com trading room. We offer a two-day free trial.


