

The E-mini S&P 500 had a first leg down from a parabolic wedge buy climax, writes Al Brooks
The E-mini S&P 500 had a first leg down from a parabolic wedge buy climax on the daily chart. It might have one more leg sideways to down. But the monthly “OO” buy signal (outside up bar after an outside down bar) still makes it likely to go sideways to up for at least a couple more months.
The monthly E-mini S&P 500 futures in July triggered a buy signal by going above the June high. June was the second consecutive outside bar on the monthly chart. Because July went above its high, there is a 60% chance of three months of sideways to up trading (see chart).
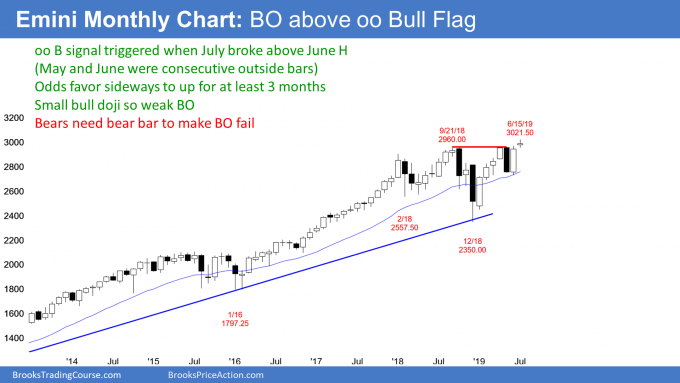
July so far has a small range. The bears want it to close near its low. Furthermore, they want the range to be big. July would then be a sell signal bar for a failed breakout above the OO indicator (consecutive outside bars).
Expanding triangle top
In addition to the possible failed breakout, there has been a triangle top all year. If the E-mini brakes above the September 2018 high and reverses, there will be an expanding triangle top sell signal.
I still believe it will happen. But there is room to the trend line above the January 2018 and September 2018 highs. It is a magnet. Also, the “OO” buy signal probably will result in higher prices.
Consequently, at the moment, the E-mini is still likely to go higher. It might overshoot the line by up to 2%. That means traders will be more concerned about a top between 3050 and 3150.
Weekly Analysis
The weekly E-mini S&P 500 futures formed a bear trend bar last week. This is a sell signal bar for a failed breakout above the September/May double top and for the 19-month expanding triangle top. However, the tail below is prominent and there is a seven-week bull micro channel. This is a weak sell setup.
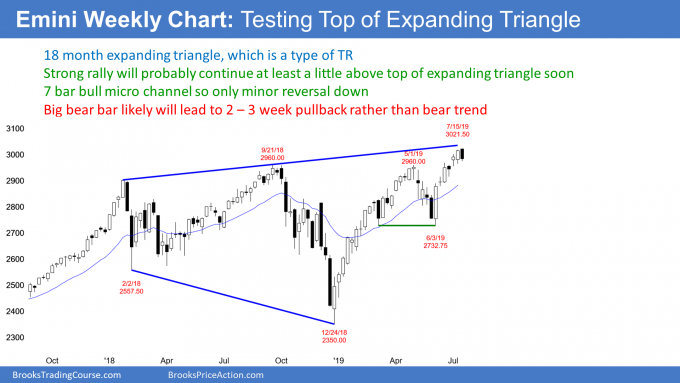
Traders want to know if there will be a major reversal. They expect this week to break below last week’s low and trigger the weekly sell signal. They then will decide if the sell signal will result in a major or minor trend reversal.
A minor trend reversal means a one- to three-week pullback, which would be a bull flag. That would then lead to a test of the high.
A major reversal is a bear trend. Traders would expect it to undo the June rally and test to around 2700.
It is important to note the importance of the bull micro channel. Every low for the past six weeks has been above the low of the prior week. This buying pressure is a sign of strong bulls. When there is a seven-bar bull micro channel, the bulls typically will buy the first one- to three-week reversal down. Therefore, if the sell signal triggers this week by the E-mini breaking below last week’s low, the selloff will more likely be a one- to three-week bull flag than the start of a bear trend.
Daily E-mini
The daily E-mini S&P 500 futures had a surprisingly big bear bar on Thursday. A Bear Surprise Bar traps bulls into a bad long. Many bulls who bought higher now wished they had not. They now hope for a bounce so that they can exit with a smaller loss. It also traps bears out of a good short. Many bears missed the short and want a second chance.
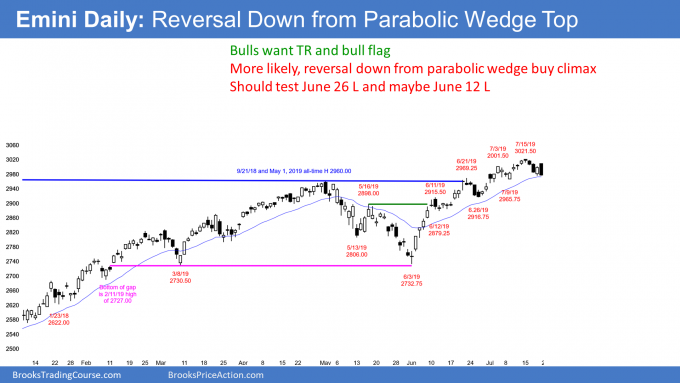
With both the bulls and bears looking to sell the first rally, the E-mini reversed down on Friday. That might be the start of a second leg sideways to down. Furthermore, the E-mini might continue its three-week trading range into the July 31 FOMC meeting.
However, last week’s reversal up was strong, as is the two-month bull trend. There is currently at least a 40% chance that the rally will continue up to a new high without a small second leg sideways to down.
Remember, I have been talking about the parabolic wedge buy climax for several weeks. I said the minimum goal was a couple legs sideways to down. I also said that the selloff might last a few weeks.
Finally, the targets for the bears are the higher lows in the month-long wedge bull channel. If Friday’s reversal down continues on Monday, traders should expect the pullback to end around 2900 – 2950.
Wedge top often leads to head and shoulders top
When there is a wedge top, traders expect at least a couple legs down. The pullback from the first leg down is often the right shoulder of a head and shoulders top.
That will probably happen here if this rally stalls next week. The bulls will probably get a three- to five-day bounce. If the E-mini reverses down from a lower high, traders will sell, expecting a head and shoulders top.
It would also be a lower high major trend reversal. But it is important to remember what I often say about major reversals. They only have a 40% chance of leading to an actual trend reversal into a bear trend. More often, they lead to a trading range. Consequently, that is the best the bears should expect over the next few weeks. The monthly chart continues to make higher prices likely for the next two months.
Trading Room
Traders can see the end of the day bar-by-bar price action report by signing up for free at BrooksPriceAction.com. I talk about the detailed E-mini price action real-time throughout the day in the BrooksPriceAction.com trading room. We offer a two-day free trial.


