

The E-mini S&P 500 had a strong selloff on Friday, but it is still within its three-week trading range, writes Al Brooks.
While the odds favor a break below the August low and 2800 in the E-mini S&P 500 within a few weeks, until it happens, there is no breakout. There is a 40% chance that Friday was a bear trap and the E-mini could reverse up this week.
The monthly E-mini S&P 500 futures chart has a bear bar so far this month (see chart). But nothing has changed on the monthly chart from what I have been saying since early July. There were consecutive outside bars in May and June. July triggered an “OO” (outside up bar after an outside down bar) buy signal when it went above the June high. At that point, there was a 60% chance that the monthly chart would be sideways to up for at least three months.
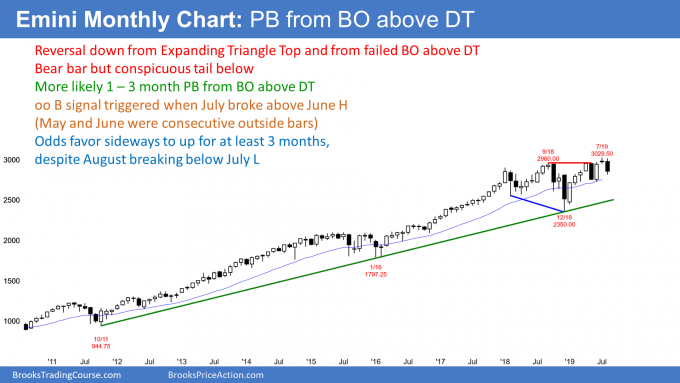
While August retraced more than half of July, it is still a second sideways to up month. This should continue at least into September.
August might be bull flag buy signal
If the August high remains below the July high, August will be a High 1 bull flag buy signal bar for September. But unless it has a bull body, which is unlikely at the moment, it would be a weak B setup.
Also, the E-mini is at the top of a 20-month trading range. Most trading range breakouts do not go far.
Therefore, the likely reward for a bull buying with a stop above the August high is not very big.
Big risk and limited reward means that the risk/reward is not strong for a stop entry buy above the August high. In addition, since most trading range breakouts fail, the probability of a strong rally is small.
When the risk/reward is bad and the probability is low, there might be more traders selling above the August high than buying. If so, the rally might only last a bar or two before there is another one- to three-month reversal down.
After the early August plunge, the weekly E-mini S&P 500 futures has been sideways for three weeks. Last week formed a big bear inside bar and it closed near its low (see chart). It is therefore a sell signal bar for next week. The bears want a strong break below this week’s low. That would represent a resumption of the August selloff.
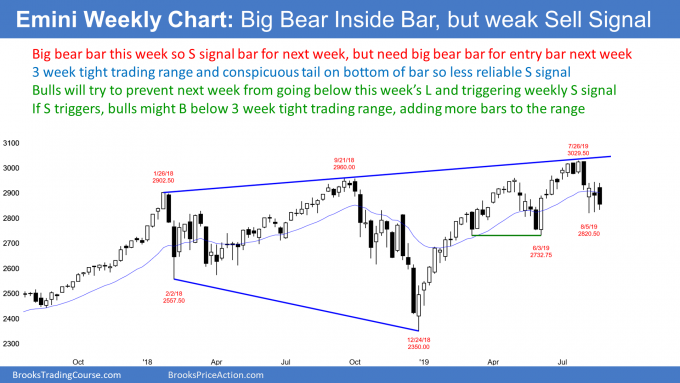
But a big inside bar in a tight trading range has a lower probability of success for the bears. The big bar means big risk. Fewer bears will sell at the bottom of a three-week tight trading range.
Also, there is a conspicuous tail on the bottom of this week’s bar. That further reduces the probability of a successful bear breakout.
Weak sell signal bar
Traders should always look to the left and not just at the sell signal bar. The context is important. A three-week tight trading range is a weak environment for a breakout. Markets often display the property of inertia, which means they tend to continue to do what they have be doing. The weekly chart has been going sideways for three weeks.
Why were the bears unable to create a better sell signal bar, like a small bear bar at the top of the three-week range? Traders should assume that it is because the bears were not strong enough to create a more convincing sell signal.
This week is important. A big bear entry bar would make a test of the June low likely.
But if the bulls can prevent this week from falling below last week’s low, they might be able to create a second consecutive inside bar. Or, if the bears trigger their sell signal, but this week closes near its high, the sell signal will likely fail during the following week. Either outcome would return the weekly chart to neutral.
Traders know that the August selloff was surprisingly strong. When there is a strong selloff, traders expect at least a small second leg sideways to down. The bulls hope that the Aug. 15 double bottom satisfied that expectation, but Friday’s selloff means that the bears have a 60% chance of a break below the August low (see daily chart below).
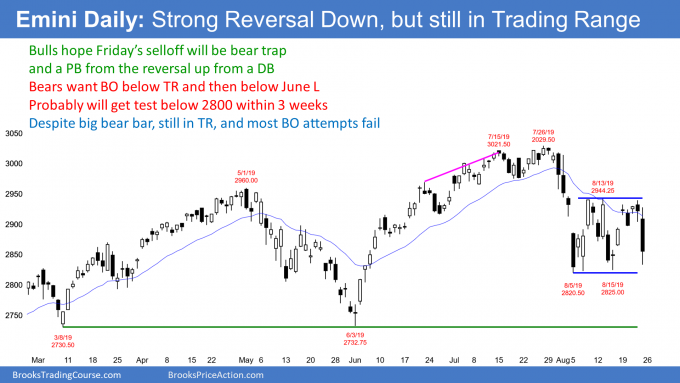
When a selloff is as strong as the August one was, the second leg typically forms a new low and not just a test of the first low. Therefore, traders should expect one more push down to below 2800 before there is a new all-time high.
But a couple big bull bars closing on their highs and above the three-week trading range would shift the probability in favor of a new high without another leg down.
The bulls have a 40% chance that Friday’s selloff was a bear trap. It might be a brief, sharp pull from the Aug. 5/Aug. 15 double bottom (a double bottom pullback). If they get a strong reversal up early this week, the odds will shift in their favor.
At the moment, nothing has changed from what I have been saying all month. The E-mini will probably fall below the August low and 2800 at a minimum within a few weeks. There is a 50% chance that it breaks below the June low. Finally, the bears have a 40% chance of a 120-point measured move down based on the height of the three-week trading range.
But don’t forget the monthly chart. Any selloff should end within a couple months. The odds still favor a new all-time high this year.
Trading Room
Traders can see the end of the day bar-by-bar price action report by signing up for free at BrooksPriceAction.com. I talk about the detailed E-mini price action real-time throughout the day in the BrooksPriceAction.com trading room. We offer a two-day free trial.


