

The QuantCyces Oscillator appears ready to reverse according to John Rawlins.
Earlier in the week we highlighted how the QuantCycles Oscillator called for a reversal in the USDJPY currency pair. That worked out pretty well.
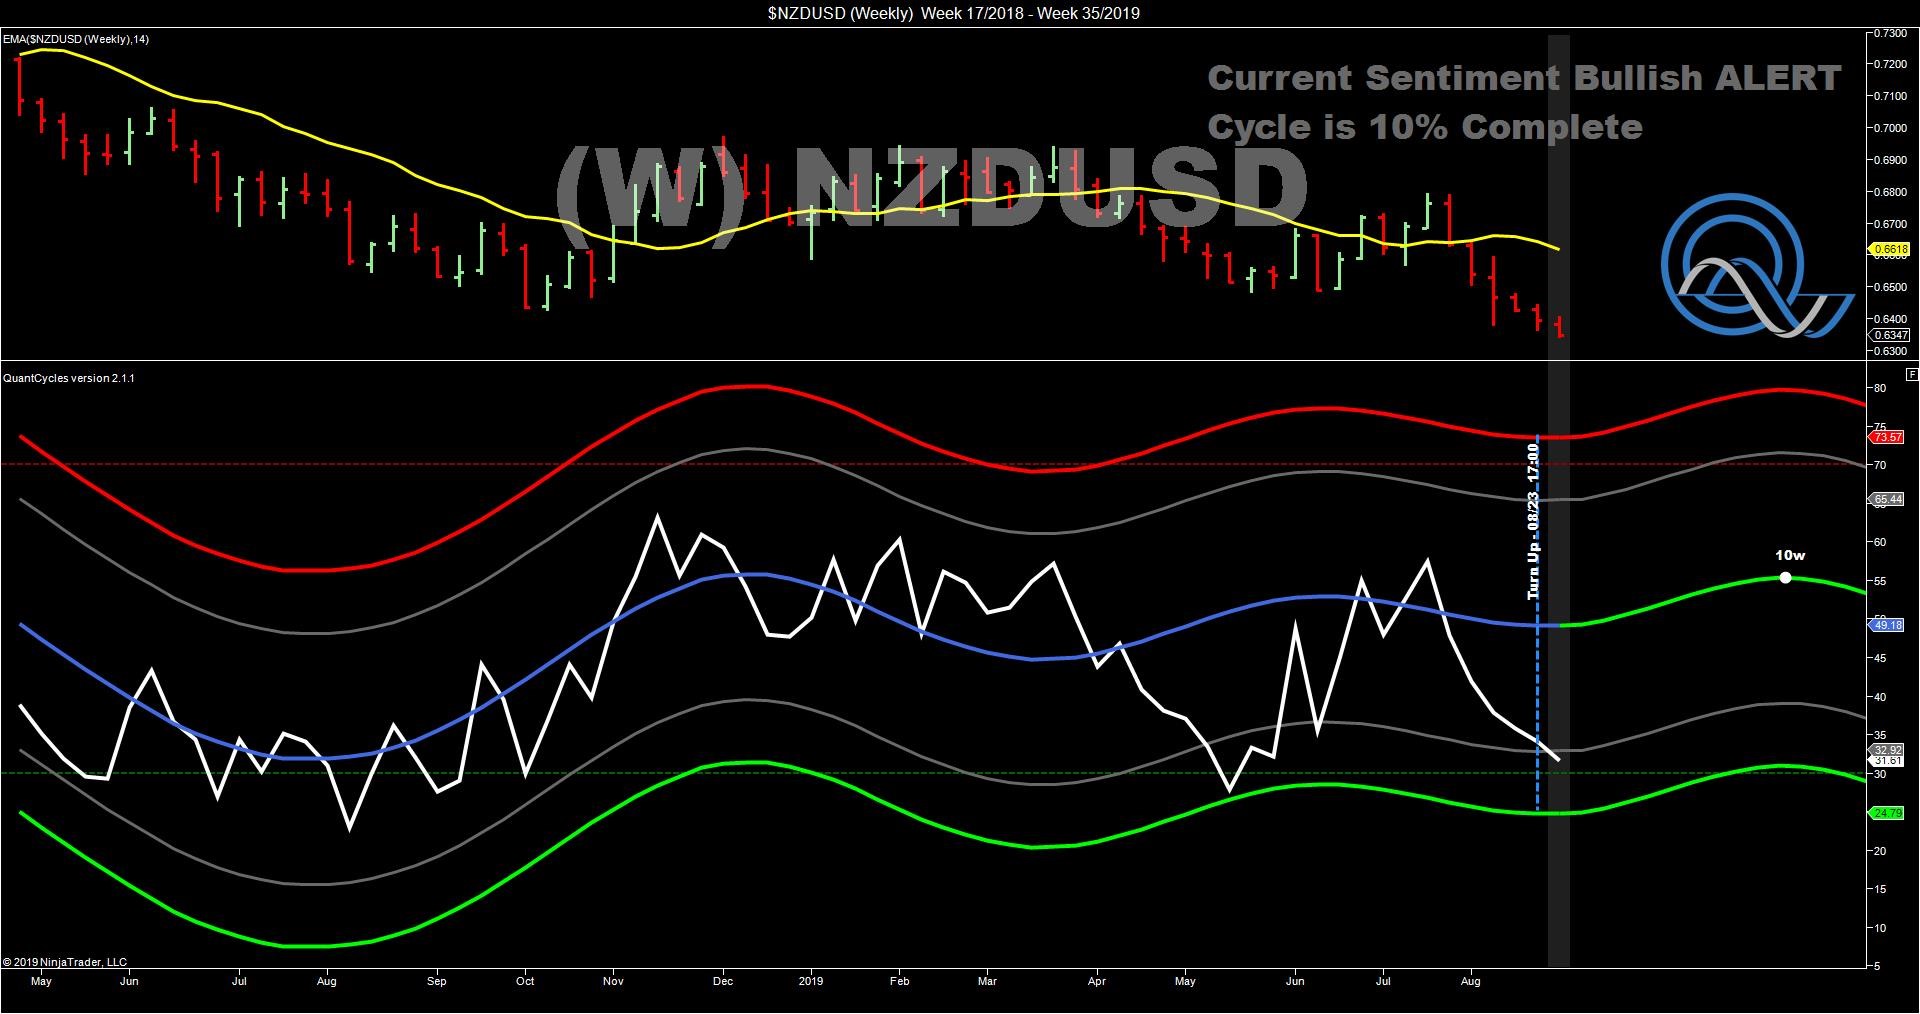
Now the QuantCycles Oscillator is anticipating a reversal in the New Zealand dollar (NZDUSD).
The oscillator anticipated a downturn in the New Zealand dollar this summer but has recently showed a bottom and turned higher. The sell-off has pushed the NZDUSD closer to major oversold territory (see chart).
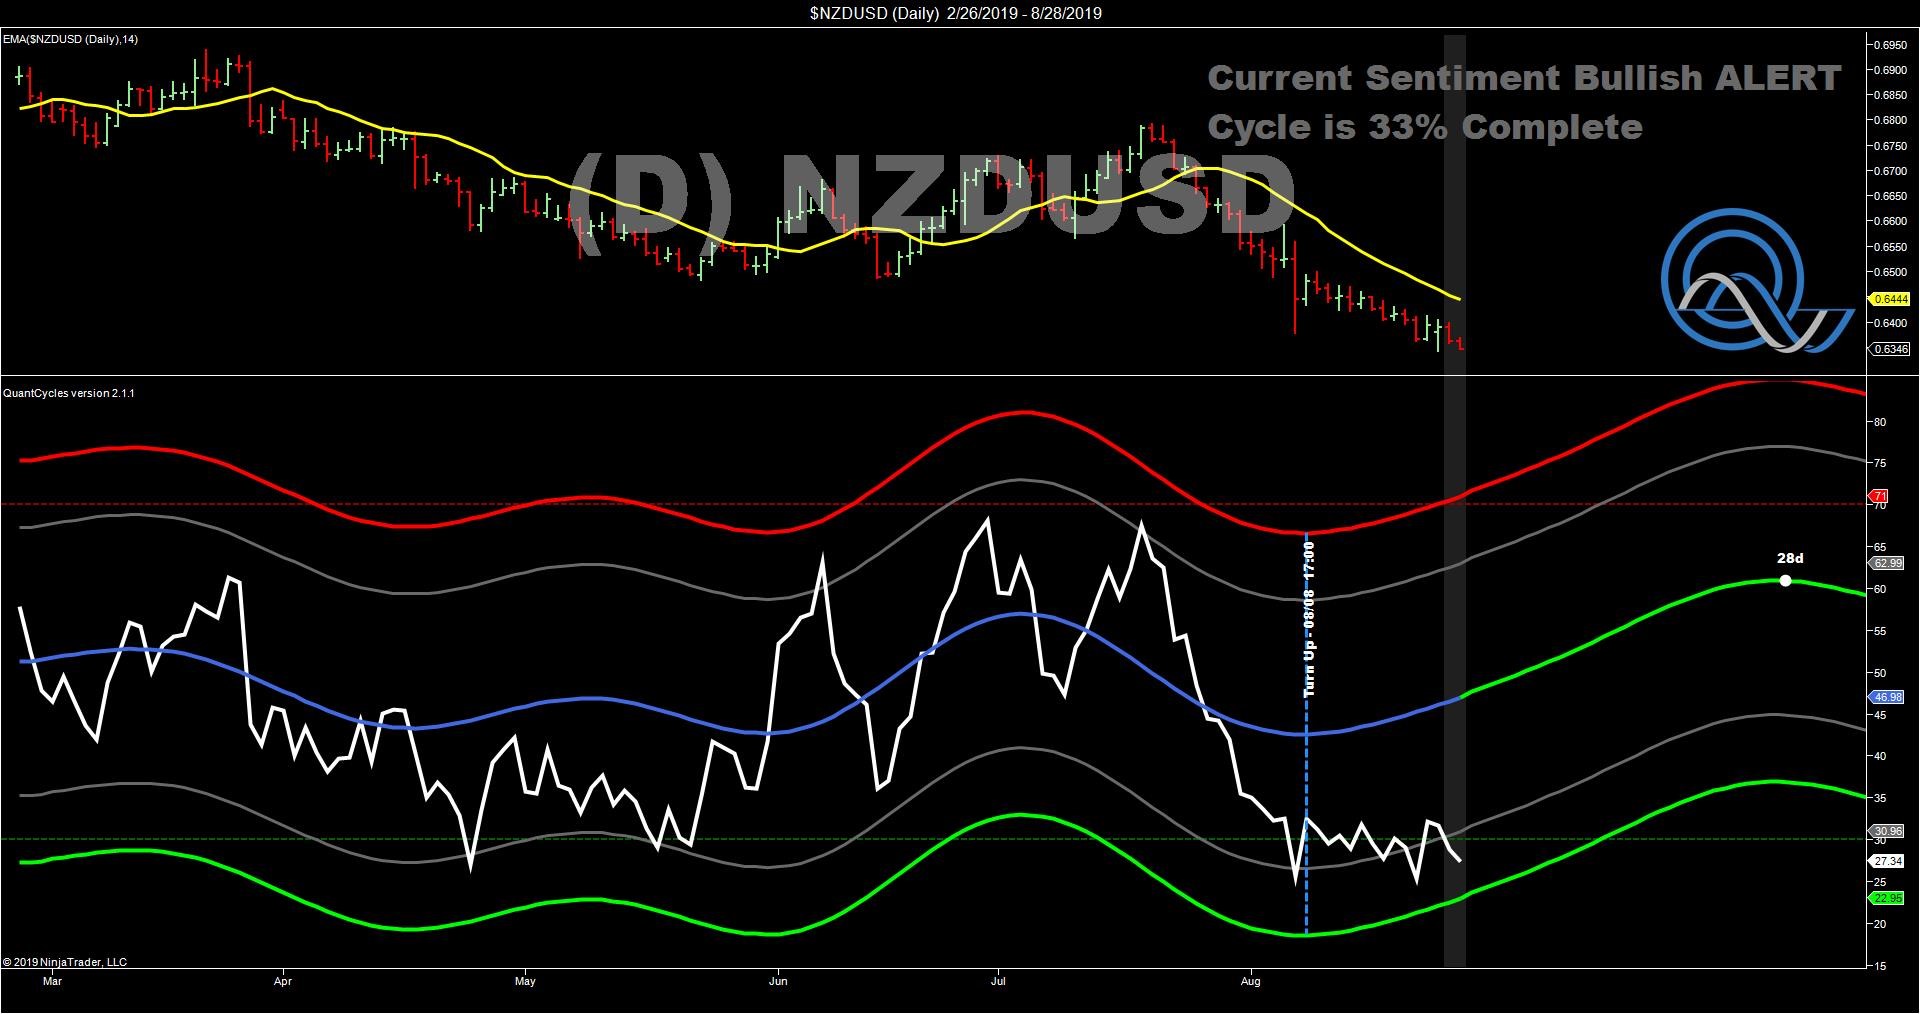
This is better illustrated in the daily oscillator. As you can see, the oscillator turned lower in July and the market responded accordingly. More recently, the daily QuantCycles chart bottomed out in mid-August. However, NZDUSD continued to drop pushing it near extreme oversold territory (see chart).
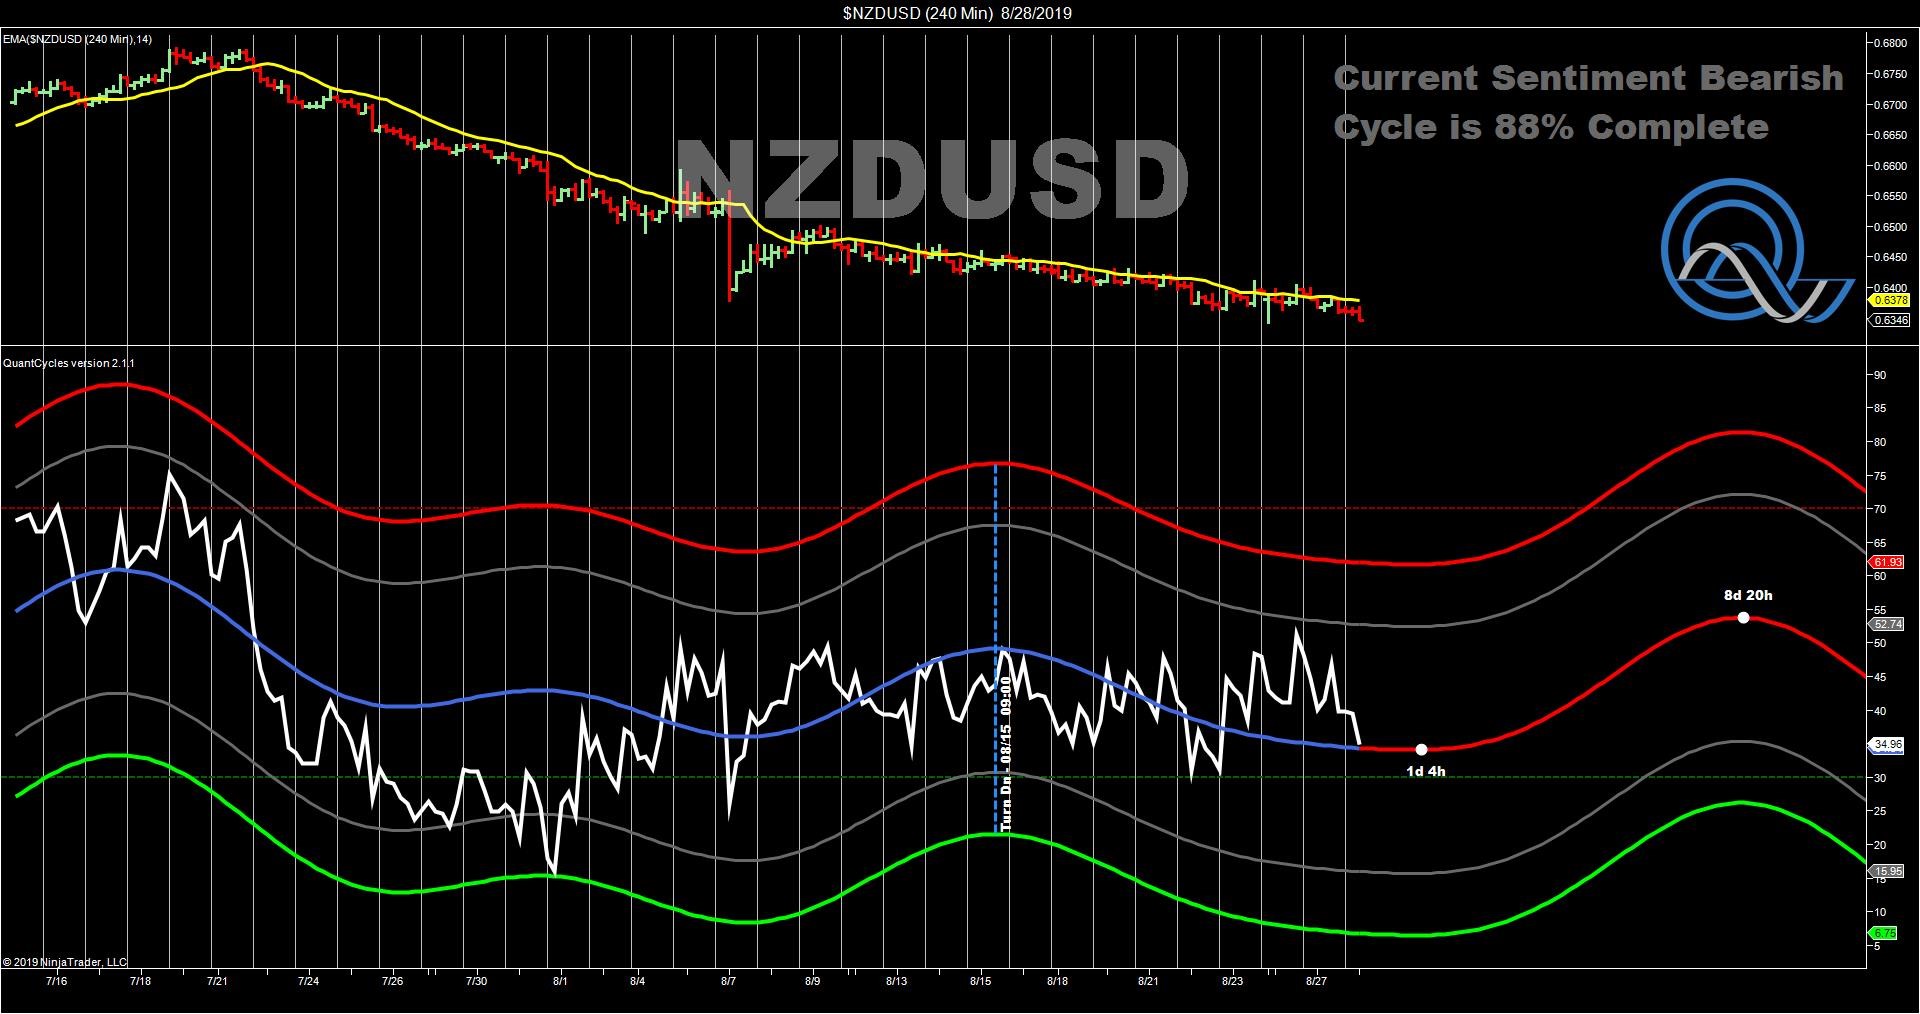
> Diving a little deeper, while the four-hour chart is not nearly as oversold as the longer-term charts, it does appear to be making a bottom this week and then turning higher.
This confirm what the daily and weekly oscillators are indicating: NZDUSD is a strong buy over he next two weeks.
John Rawlins described the value of the QuantCycles Oscillator recently at The Orlando MoneyShow.
The QuantCycles indicator is a technical tool that employs proprietary statistical techniques and complex algorithms to filter multiple cycles from historical data, combines them to obtain cyclical information from price data and then gives a graphical representation of their predictive behavior (center line forecast). Other proprietary frequency techniques are then employed to obtain the cycles embedded in the prices. The upper and lower bands of the oscillator represent a two-standard deviation move from the predictive price band and are indicative of extreme overbought/oversold conditions.


