

Gold futures have rallied strongly but is facing significant resistance. It might pause here for a month or two, but traders should expect at least slightly higher prices, says Al Brooks.
Gold futures have trended up strongly for four months. The rally began with a double bottom higher low major trend reversal on the monthly chart in August 2018 (see chart below).
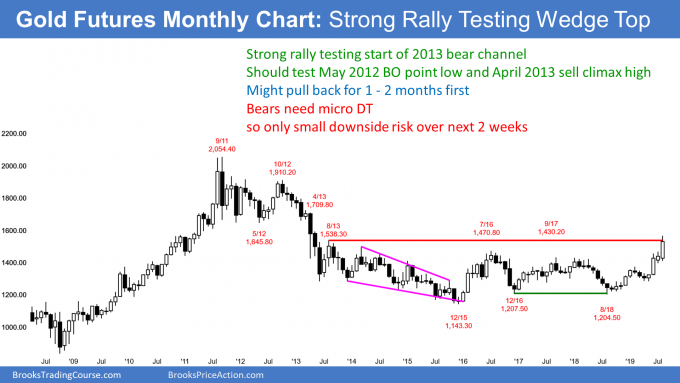
As strong as the rally has been, it is now testing the August 2013 high. Why is that important? Because beginning in April 2013, there was a three-month strong bear break below a bull trend line. That was a bear spike. The bear channel began with the top of the August 2013 rally.
When there is a Spike and Channel bear trend, traders expect a bull breakout above the bear channel. The rally typically tests the start of the bear channel. In this case, it was the August 2013 high. Then, the chart typically enters a trading range.
The 2019 rally went just above that August 2013 high. As strong as the rally has been, many traders will begin to take profits. That is because the rally reached a resistance level where a trading range typically begins.
A trading range has bull and bear legs. The 2019 rally is a bull leg. The bulls hope it is the start of a bull trend that will break above the September 2011 buy climax high. More likely, the bulls will start to take profits and the bears will soon sell. Both know that the rally will probably stall for at least a couple bars on the monthly chart. That means a one- to two-month trading range on the daily chart.
Do the bulls have to exit?
Investors will hold long, even if there is a two-month reversal down to $1,400 and the January 2018 high. Traders, however, will quickly take profits if they sense that widespread profit-taking is underway.
How will they know if the profit-taking might last a couple months and test all the way down to $1,400? They look for either a surprisingly big bear bar or a series of three or more smaller bear bars closing near their lows.
Both represent strong profit-taking and they increase the chance of at least 10 bars down on the daily chart. More likely, the daily chart would test the July trading range at around $1,400, which is also the January high breakout point.
How far will a pullback fall?
The June/July rally had three legs up on the daily chart (not shown) and it is therefore a wedge rally. A reversal down from a wedge typically tests the start of the wedge. That is the pullback after the first leg up. Here, it is the July low at around $1,400.
Was this week’s selling a likely candidate for the start of a one- to two-month pullback? The bears need to do more. The three-month rally has been in a tight bull channel. The first break below the bull trend line typically leads to a bull flag or trading range and not a bear trend. Traders therefore expect a trading range over the next couple of weeks and not a bear trend.
The trading range could be another bull flag that would lead to higher prices. But with a wedge rally on the daily chart and the monthly chart testing the resistance of the August 2013 high, the upside over the next few weeks is probably small. This is despite the strong bull trend.
Trading Room
Traders can see the end of the day bar-by-bar price action report by signing up for free at BrooksPriceAction.com. I talk about the detailed E-mini price action real-time throughout the day in the BrooksPriceAction.com trading room. We offer a two-day free trial.


