

There is 50/50 chance the recent breakout in the S&P 500 will fail, writes Al Brooks.
The E-mini S&P 500 broke above the top of a ledge on the weekly chart last week but there is a 50% chance that the breakout will fail.
The E-mini S&P 500 futures has a bull inside bar on its monthly candle for September (see chart below). We have discussed the “OO” (outside down bar followed by an outside up bar) buy setup since June went above the May high. May was an outside down month and June was outside up. They therefore formed consecutive outside bars in a bull trend.
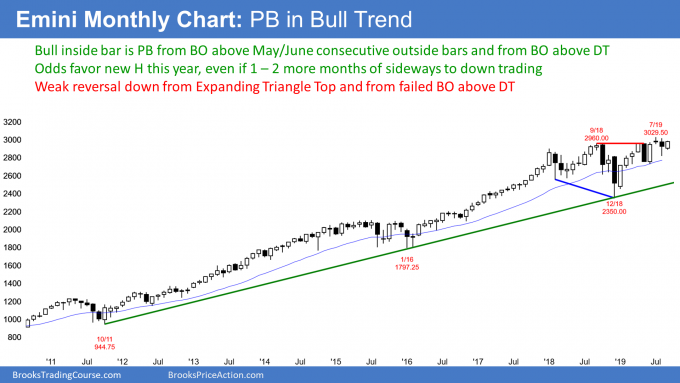
That is a bull flag. Once July went above the June high, there was a 60% chance that the next three months would be sideways to up. September is the third month and the E-mini is back at the June high. That was the entry price for the bulls. Consequently, there have been three sideways months since the June “OO” buy signal. That is the minimum objective for the bulls.
Where does the E-mini go from here? An “OO” pattern is an expanding triangle on a lower time frame chart. A triangle is an area of agreement. If the E-mini goes above or below, it tends to get drawn back into the triangle. Therefore, a rally from here might only last a few months before it gets pulled back into the triangle.
E-mini has expanding triangle top or megaphone pattern
I have mentioned many times over the past four months that the monthly chart has a bigger expanding triangle that began with the January 2018 high. It might be easier to see on the weekly chart.
An expanding triangle means that the E-mini keeps making new highs and lows, but each one soon reverses. As a result, the E-mini monthly chart has a 40% chance of a reversal down to the bottom of the triangle at the December low.
But when? The bulls might continue the rally for a few more months. Any more than that would probably mean that the triangle is no longer significant.
July was the sell signal bar. But it was a small doji. That typically is not strong enough to reverse a strong bull trend. Most traders will want to see a second sell signal.
For example, October or November might become a sell signal bar for a micro double top or a wedge top. If October or November goes above July and reverses, it would be the third leg up from December. The first two legs were the May and the July highs. If the month is a big bear bar closing near its low, traders would see that as a much more reliable sell signal.
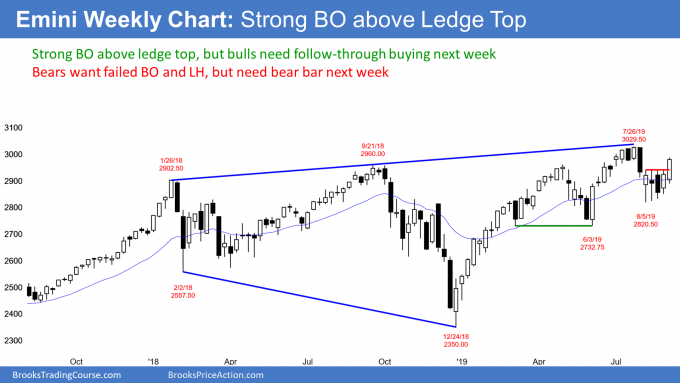
The E-mini S&P 500 futures has been in a tight trading range for four weeks prior to last week’s bull breakout on its weekly chart (see chart). The reason I said that a bull breakout was likely last week is that the trading range had a ledge top.
On a five-minute E-mini chart, a ledge top is dour or more bars in a tight trading range with the same high. On higher time frame charts, you will never see a perfect ledge. But markets are fractal. That means all time frames behave the same. Consequently, ledges on daily and weekly charts behave like those on the five-minute chart, even though the highs are not identical.
What happens after a ledge top?
The closer a ledge is to perfect, the more it will behave like a ledge. The ledge top of the weekly chart is the most perfect one in many years. On a five-minute chart, there is an 80% chance of a breakout above the ledge.
Furthermore, there is then an 80% chance of a pullback below the top of the ledge. It typically comes within 20 bars, but sometimes not for 100 bars. That pullback sometimes grows into a bear trend.
On the weekly chart, it is impossible to accurately assess the probabilities because ledges are so rare. There is not enough data to calculate reliable statistics. But traders should assume that the odds of the bull breakout and the pullback are still very high.
The bulls got their breakout last week. There will probably be a pullback below the top of the ledge within a few weeks. It could come this week.
If the reversal down is strong, the odds will again shift in favor of a break below the five-week trading range and below 2800. If the reversal down is weak, it will probably form a bull flag. Traders will then look for a new all-time high within a month or two.
But even if the bears get their reversal down, traders will buy a test of either 2800 or 2700. The monthly chart is still bullish enough to make at least one more new all-time high this year, even if there is a selloff to 2700 first.
The E-mini S&P 500 futures gapped above the top of a five-week trading range on the daily chart on Thursday (see chart). However, the E-mini did not form a pair of big bull trend bars closing on their highs. Traders sense that the breakout is not as strong as it could be.
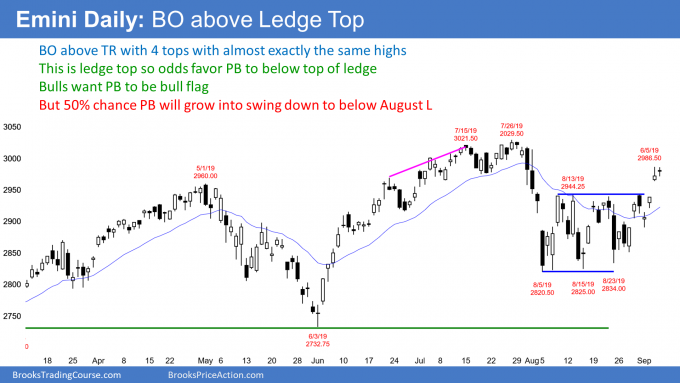
Compare it to the June break above the May bear channel. There were many bull bars closing above their midpoints or near their highs. That led to a strong two-month rally.
In addition to the lack of big bull bars, there are other problems that reduce the chance of a successful breakout. I mentioned earlier that a break above a ledge top typically has a reversal down back below the ledge top. Therefore, even if this breakout continues for a week or two, there will probably be a pullback to below the 2944.25 top of the five-week trading range.
Also, a trading range is a magnet. It is an area of agreement and it resists breaking out. In general, there is a 50% chance that the first strong breakout above a trading range will fail. For example, a gap down next week would create an island top. While an island top typically is a minor sell signal, in the current context, it could lead to a second leg down to 2700 – 2800.
The monthly and weekly charts have an expanding triangle top. That makes many bulls hesitant to buy near the high.
It is important to remember how strong the August selloff was. A selloff that strong usually has as least a small second leg sideways to down. Sometimes there is a strong rally after the first leg down, but that rally then reverses down from a lower high and leads to a second leg down.
Testing the July 18 Double Top Neckline
On the five-minute chart, both Thursday and Friday oscillated around the July 18 low of 2975.75. That is the neckline of the July 15 and July 26 double top. If the E-mini sells off next week, then the rally from the August low would simply be a breakout test of that low.
What do the bulls need to increase the probability of a successful breakout and a rally to a new all-time high? They need buying pressure, which means a sign that the bulls are more aggressive than the bears. That can be one or more big bull bars closing near their highs, several small bull bars, or a small pullback bull trend in a tight bull channel.
Now, the bulls have none of this. Until they can demonstrate more strength, traders will assume that this breakout has a 50% chance of forming a lower high and reversing down to 2700 – 2800.
Trading Room
Traders can see the end of the day bar-by-bar price action report by signing up for free at BrooksPriceAction.com. I talk about the detailed E-mini price action real-time throughout the day in the BrooksPriceAction.com trading room. We offer a two-day free trial.


