

The E-mini S&P 500 broke its bull run and could be in for a stronger correction, writes Al Brooks.
The E-mini S&P 500 finally broke below the six-week bull channel on the daily chart. Traders should expect two weeks of sideways to down trading.
The monthly S&P500 E-mini futures chart has a bull bar so far in November. Also, the gap above the October high is still open (see chart below).
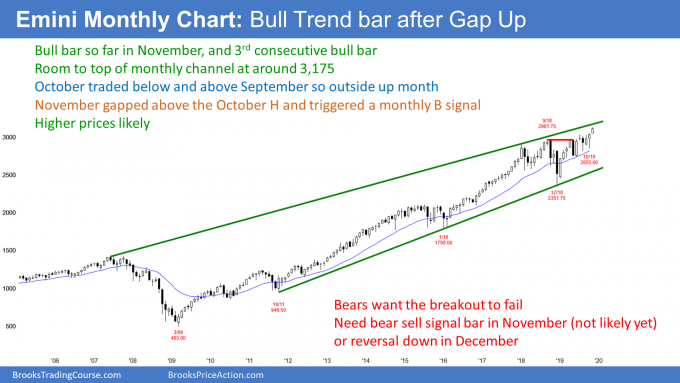
This week is the final week of the month. Since Thursday is a holiday and Friday will have light trading, there is not much time left. Traders expect the month to remain a small bull trend bar. However, if there is a selloff this week, there will be a prominent tail on the top of this month’s candlestick. That will make November less bullish. The bears will have to wait at least one more month before they can hope to create a reliable sell signal bar.
And even when they finally get a sell signal bar, it will be in a tight bull channel. A reversal down will probably only last a month or two, like all of the other selloffs over the past two years.
Top of bull channel is a magnet above
Monthly trendlines are very important. Every major selloff since 1929 has reversed up at a bull trend line on the monthly chart.
The tops of bull channels are also important. Draw a line from the May 2007 high to the January 2018 high. The current rally is the third leg up in that bull channel. That line is around 3170. It is therefore a magnet.
When a reversal comes from a line on the monthly chart, there is usually an overshoot. Therefore, the current rally might reach 3200 or 3250 before the bulls will take profits and the bears will sell. This is true even if there is a pullback for a month or two before the E-mini reaches the line. However, there will probably be sellers up there.
How big of a reversal can the bears get? Well, the 2019 rally has been in a tight bull channel. A tight bull channel usually needs to go sideways for several bars before the bears can get a significant reversal. Therefore, the downside risk over the next couple months is small.
There is another problem for the bears. Traders like to see symmetry when they draw lines. The space between the first two points for this line is much bigger than between the second and upcoming third point. That is a less reliable line. It therefore is less likely to lead to a significant selloff. A pause for a few months is more likely than a bear trend.
First bear bar after 6 consecutive bull bars
The weekly E-mini S&P 500 chart finally had a bear body last week (see chart). This was likely since six consecutive bull trend bars is unusual late in a bull trend.
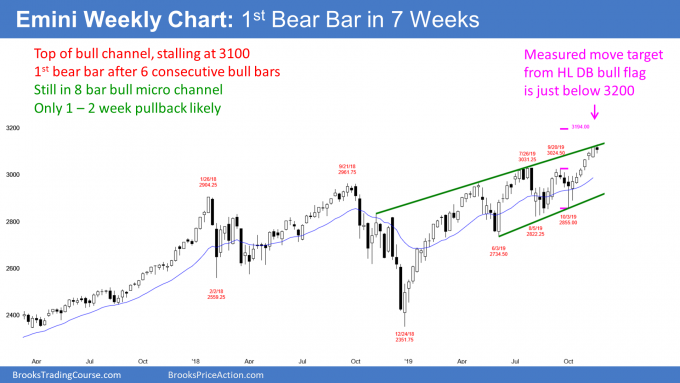
Also, last week’s range increased. When there is a buy-the-close bull trend and the fifth or sixth bar increases in size and closes near its high, it typically attracts some profit-taking. The stop for the bulls is far below and the bulls want to reduce their risk. The easiest way is to reduce their position size.
Since they suspect that there will be a pullback soon, they see a big bull bar as a gift. It is a great and probably brief opportunity to take unexpectedly big profits. And many do.
This typically results in a couple weeks of sideways to down trading. Traders therefore will look for a little more of a pullback over the next week or two.
A common target is the bottom of the most recent buy climax. That is the 3074.50 low of that big bull bar from last week. I have been saying that a 50- to 100-point pullback was likely. That low is 53.5 points below the high and it would meet my minimum objective.
First pullback will be brief
When traders take profits, they do not immediately buy again. That is why I said that the pullback might last a couple weeks.
However, there has not been a pullback in eight weeks. The bulls have been so eager to buy that they have been buying above the low of the prior week for a long time. Once they finally get an opportunity to buy below the low of the prior week, they will probably take it. That will limit the extent of the first reversal down.
But once the bull trend resumes, traders will pay attention to what happens on the test of the close of last week’s big bull bar. Will the bulls continue to buy and create another leg up? Or, will they be very disappointed by the pullback?
If so, the bulls who bought at the top of that bull bar will use the rally to exit their longs around breakeven. This would be a sign that they are afraid of another and bigger leg down.
If they do sell out of their longs, that selling would create a micro double top. The bears at that point would have a better chance of a deeper pullback. Their first target would be the July/September double top. That is the breakout point of the two-month rally.
Stalling at the top of the weekly bull channel
There is a bull trend channel line around 3170 on the monthly chart. It is based on the 12-year bull channel. There are bull channels on the weekly and daily charts as well. On the daily chart, the channel began in mid-October. The top of that bull channel is around 3165.
The weekly channel began with the Nov. 7, 2018 lower high. The current rally poked a little above the top of the channel during each of the past two weeks.
The weekly chart is therefore stalling at this resistance. But because the bull trend over the past eight weeks has been in a micro channel, the bears will probably not be able to get a reversal down at this point. The best they probably can get is a small pullback, like a couple weeks of sideways to down trading. Traders typically like to see at least a micro double top before they will sell aggressively. The July 26 top is an example.
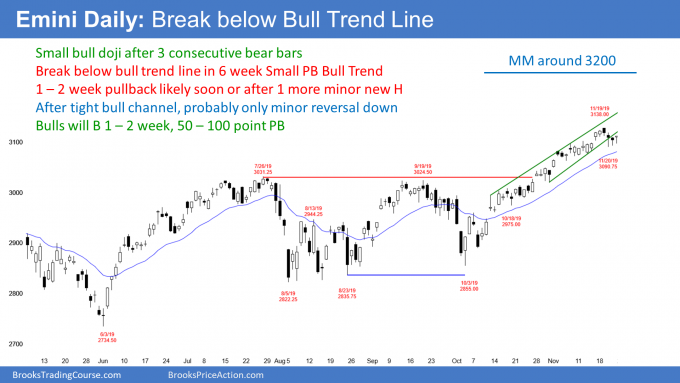
The daily E-mini S&P 500 chart has been in a Small Pullback Bull Trend for seven weeks. Every pullback lasted only a day or two before the bulls regained control.
But there is something different this time. The bears finally broke below the bottom of the bull channel. That increases the chance of a couple legs sideways to down over the next week or two. This is true even if there is a brief new high first.
The daily and weekly charts are in buy climaxes. That typically attracts profit-takers. This rally is about as long as the several other rallies in 2019. Each was followed by profit-taking and a 5% to 8% correction.
Traders therefore expect at least a small correction this time as well. But it might only be about 2%. That is because the six consecutive bull bars on the weekly chart mean that the weekly bulls are very eager. They will therefore probably buy the first one to two-week pullback on the weekly chart.
It also means that the selloff on the daily chart will probably not last very long. Additionally, it increases the chance of it not being as big as the other selloffs in 2019. That is why I have been saying that it might only be 50 to 100 points instead of 200 to 300 points.
However, after the pullback and then a new high, the bears will have a better chance of a correction. This is especially true if the E-mini reaches the top of the monthly channel just below 3200.
Trading Room
Traders can see the end of the day bar-by-bar price action report by signing up for free at BrooksPriceAction.com. I talk about the detailed E-mini price action real-time throughout the day in the BrooksPriceAction.com trading room. We offer a two-day free trial.


