

With the recent implosion in the price of crude, the risk/reward of a long-term long position looks good especially when viewing this long-term oscillator, writes John Rawlins.
It is difficult to provide technical/cyclical data in the midst of a major fundamentally driven move—especially when what is driving the move is one, no two largely unknown, i.e. Black Swan events. That is the extreme demand destruction in crude oil due to the Coronavirus and the production war raging between Saudi Arabia and, well the rest of the world, but Russia in particular.
Still, our QuantCycles Oscillator has come up with a compelling long-term outlook in crude oil.
First, we must tell you the data goes back 100 years and not just the relatively short cycle of the Nymex crude oil futures contract.
Adding to that is the fact that the same chart our data created 18 months ago is compelling as well.
This is a comparison of the monthly crude oil analysis18 months ago and now. This is based on our proprietary 100 year plus monthly crude oil data. The significance of this comparison was the optimization process used 18 months ago to determine the inputs were still the same as the current optimization. THAT IS VERY SIGNIFICANT.
Below is what the data showed 18 months ago.
September 2018 analysis of the Monthly Crude
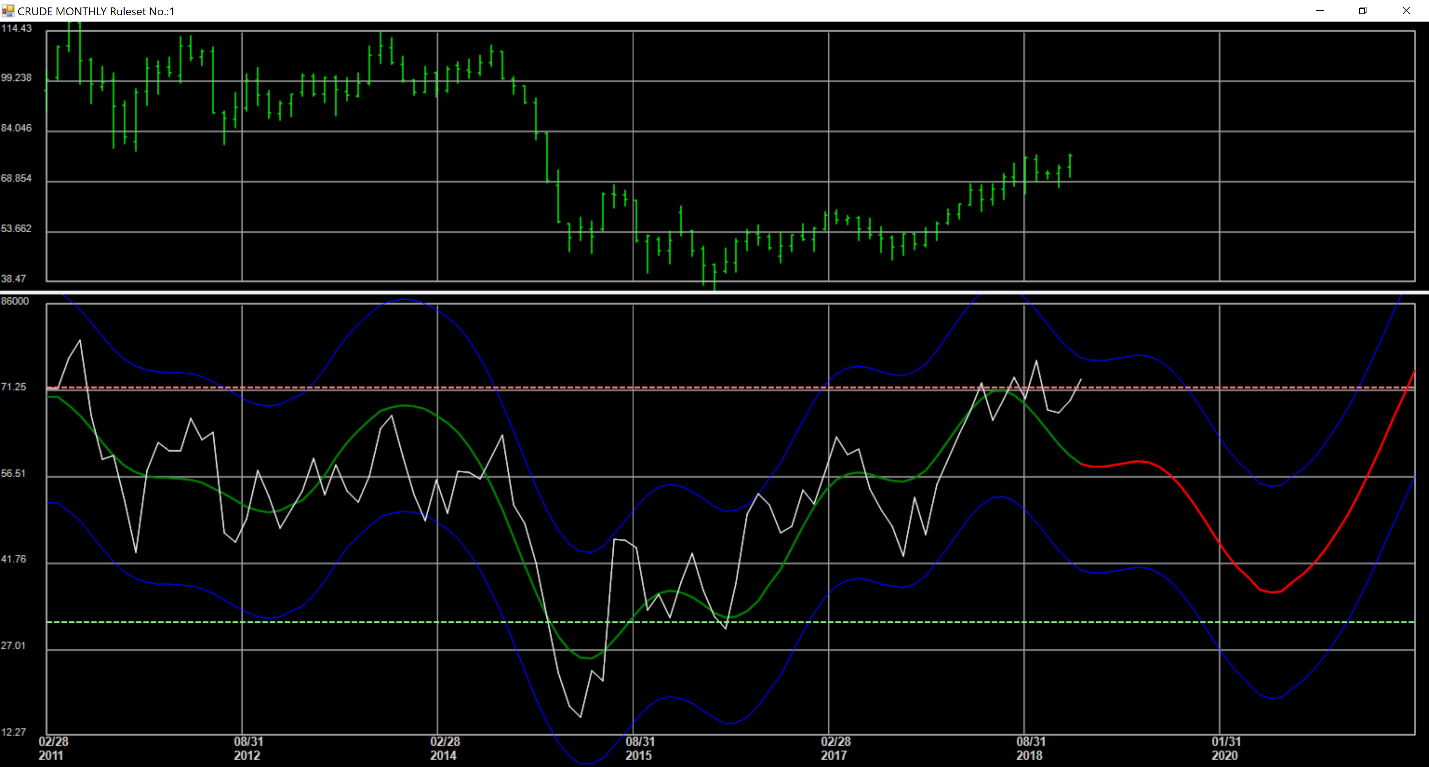
As you can see, it pretty accurately predicted the current move, if perhaps a little early.
Now look at want the data is showing now (below).
March 2020 analysis of the Monthly Crude
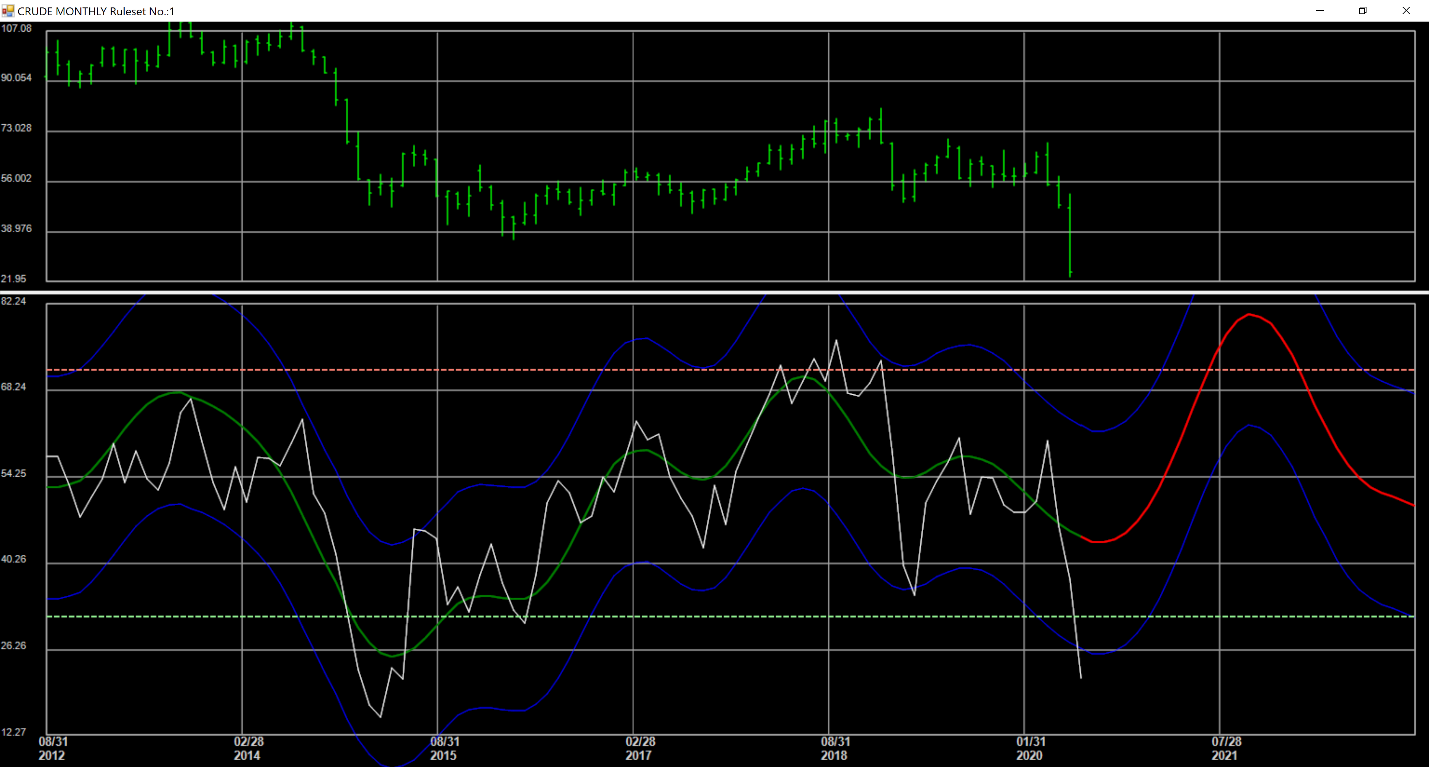
As you would suspect, crude oil is extremely oversold. It is also very near the end of its current cycle and is expected to rise sharply relatively soon.
Judging by the chart, traders could expect crude to triple from today’s low by Q3 2021. Of course, based on the current move that is not that extreme.
The tough thing about long-term outlooks is that the short-term is so volatile. However, with crude sitting around $20 the risk reward looks good. Traders may want to go out on the curve further to get long.
John Rawlins described the value of the QuantCycles Oscillator recently at The Orlando MoneyShow.
The QuantCycles indicator is a technical tool that employs proprietary statistical techniques and complex algorithms to filter multiple cycles from historical data, combines them to obtain cyclical information from price data and then gives a graphical representation of their predictive behavior (center line forecast). Other proprietary frequency techniques are then employed to obtain the cycles embedded in the prices. The upper and lower bands of the oscillator represent a two-standard deviation move from the predictive price band and are indicative of extreme overbought/oversold conditions.


