

While the long bond has provided a bull signal, it won’t likely breakout of range, reports Al Brooks.
U.S. 30-year Treasury bond futures have been trading sideways for eight weeks after an extreme buy climax. It will probably be in a trading range for the remainder of the year.
The 30-year Treasury bond futures formed a small bull doji bar in April on the monthly chart (see below). Its high was far below the March high and its low was far above the March low. April was therefore a small inside bar.
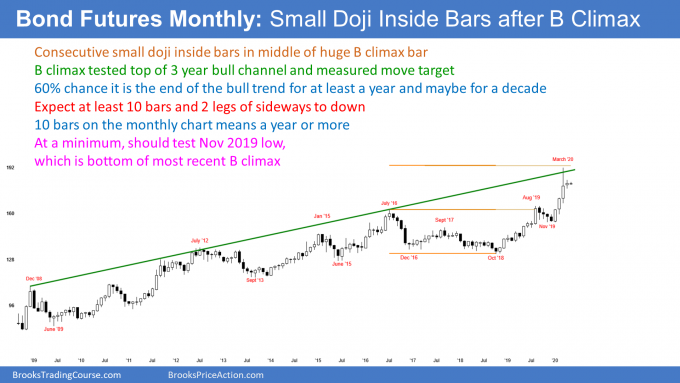
Only one day into the new month and the May candlestick is within April’s range. There are now consecutive inside bars. This is an Inside-Inside (II)) pattern. This tight range is a reflection of the bond futures being in an eight-week tight trading range on the weekly chart and a triangle on the daily chart (not shown).
Also, March was a huge bar but it closed almost exactly in its middle. The big tail on its top means that traders sold strongly into the end of the month. That close in the middle is a sign that the strong bull trend is now neutral, at least for the moment.
Traders know that the three-month rally was the most extreme in the history of the bond market. Many bulls used the big March rally to take surprisingly be profits.
Does buy climax mean the bull trend is over?
The selloff from the March high was big enough to make traders wonder if the bull trend has finally ended. They need more information.
But with exhausted bulls and scared bears, the bond market will probably have to go sideways for many bars before it begins to trend again. Traders believe that the past two months are the start of a trading range that will last all year.
Weak Buy signal
April was a bull inside bar in a bull trend. It is therefore a High 1 bull flag buy signal bar.
There was extreme profit-taking at the end of March. Traders know that the bulls are exhausted. They will not want to buy aggressively again until after they see how strong the bears can be.
The bulls typically want to see at least a couple legs down. If the legs down are strong, the bulls will wait for the market to go sideways for several bars before buying again.
However, if the two legs are more sideways than down, the bulls will doubt the resolve of the bears. That will make the bulls more willing to buy again.
How long before traders decide on direction?
This process of deciding how strong the bears are typically takes about 10 bars to complete. Since this is a monthly chart, the bond futures will probably be sideways for the rest of the year.
What about the April buy signal bar? Since it is coming immediately after strong profit-taking, there will not be sustained buying above its highs. Traders expect a second leg down. Consequently, the bulls will take quick profits and the bears will sell above the April buy signal bar’s high.
As an inside bar after a buy climax, April is also a sell signal bar. But it has a bull body and a small range. It is also the fourth consecutive bull bar on the monthly chart. Traders see that as a weak sell signal. Therefore, they expect buyers not too far below.
With buyers below and sellers above, the odds favor more sideways trading. As I said, the bond futures will probably be sideways for the remainder of the year.
Trading Room
Traders can see the end of the day bar-by-bar price action report by signing up for free at BrooksPriceAction.com. I talk about the detailed E-mini price action real-time throughout the day in the BrooksPriceAction.com trading room. We offer a two-day free trial.


