

Al Brooks breaks down the technical outlook in the long bond.
The U.S. 30-year Treasury bond futures market has rallied for nine straight weeks. However, it will probably begin to pull back for a week or two.
The tight bull channel on the weekly chart created a bull breakout in July on the monthly chart (see below). August is the follow-through bar. Traders know that if August has a bull body, September will probably also go at least a little higher. But if August has even a small bear body, September will probably be sideways to down.
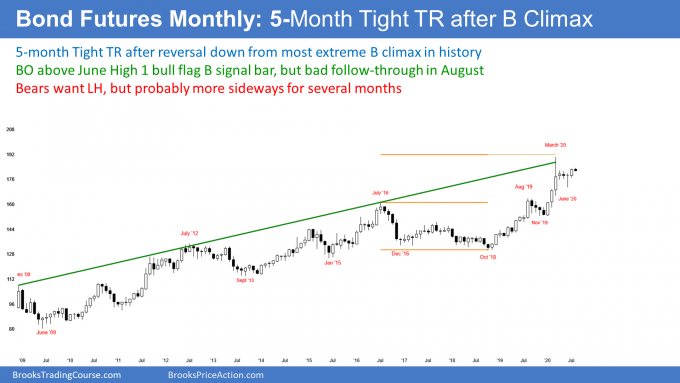
September is usually not a strong month in the stock and bond markets. Therefore, if September is to stall or pull back, August will probably have to close below the open of the month. That would require a one- to two-week pullback on the weekly chart.
Traders know that there is an increased chance of a bear bar on the monthly chart in August. They therefore expect the nine-week bull channel on the weekly chart to begin to turn sideways soon.
Weekly bond futures chart stalling at April high
The 30-year Treasury bond futures weekly chart had another low above the prior week’s low (see below). But the range was small. The bond futures are pausing around the April 22 lower high.
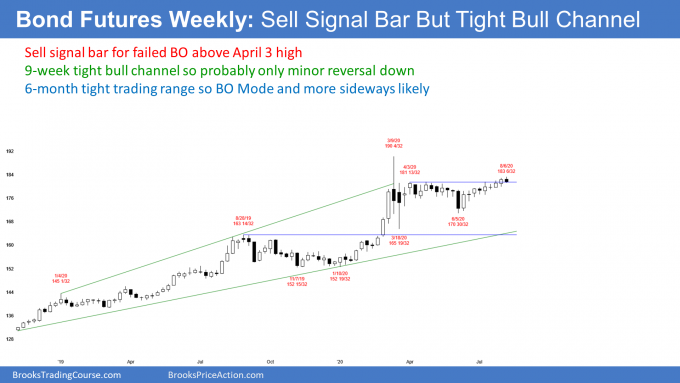
Traders are still not sure if the rally will break above the March high or form a lower high. But the weekly chart has been in a tight bull channel for nine weeks. While the price is not racing up, that persistent buying reduces the chance of a sudden selloff.
With traders buying above the prior week’s low for such a long time, they will be eager to buy below the prior week’s low once they finally have the opportunity. Consequently, the first reversal will probably only last a bar or two (a week or two). There should then be at least a brief second leg up. Therefore, most traders will not aggressively short until there is at least a micro double top, which will take at least a couple more weeks to form.
Bonds’ Small Pullback Bull Trend
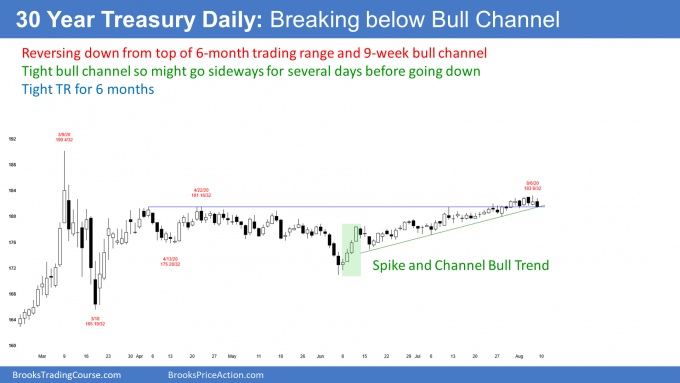
A micro channel on the weekly chart is always a Small Pullback Bull Trend on the daily chart. In this case, it is also the bull channel in a Spike and Channel bull trend (see chart below). The four bull bars on the reversal up from the June 5 low formed the spike. That was the bull reversal from the June sell climax.
Since the rally entered the channel phase with the June 16 pullback, traders have been buying every one- to three-day pullback. The result has been a tight bull channel (Small Pullback Bull Trend).
Some Small Pullback Bull Trends last 50 or more bars and accelerate up. Those that do typically have two or more sets of consecutive big bull bars closing near their highs. This rally lacks those strong breakouts. It is therefore more likely a bull leg in what will become a trading range.
Traders should expect a break below the bull trend line within a couple weeks. They then should look for a possible two- to three-week test down to around the June 16 start of the bull channel. This is consistent with the likely sideways to down trading on the weekly chart. Also, it is consistent with the possible sideways move through September on the monthly chart.
Trading Room
Traders can see the end of the day bar-by-bar price action report by signing up for free at BrooksPriceAction.com. I talk about the detailed E-mini price action real-time throughout the day in the BrooksPriceAction.com trading room. We offer a two-day free trial.


