

On numerous occasions recently the lack of tall confident price bars on the S&P 500 (SPX) was highlighted, explains Ian Murphy of MurphyTrading.com.
The narrow range bars have continued but now we also have strong divergences between the index (which is making new highs) and all stocks in the market (which are not).
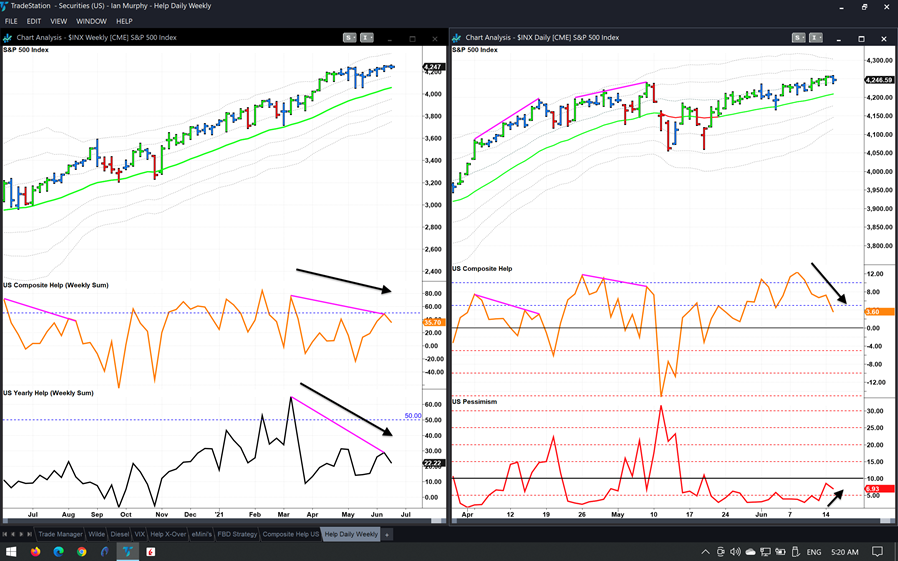
Composite Help has been falling steadily since June 8 and Pessimism (stocks making new 20-day lows) has been creeping slowly up (right hand chart). There may be opportunities in individual stocks, but I would not be opening long positions on instruments that track the S&P 500 until these divergences are resolved.
On a weekly time frame (left chart) the divergences are more pronounced and powerful. On the bottom (Yearly Help Weekly Sum) is a rolling five-day sum of yearly new highs less yearly new lows. The last time we saw a divergence this strong was between January and February 2020 just before the Covid-19 selloff in March 2020.
This does not mean we are guaranteed a selloff soon, rather these divergences are like gathering rain clouds. The more clouds there are in the sky and the darker they are, the greater the chance of rain, and all the more reason not to put the washing on the line.
Learn more about Ian Murphy at MurphyTrading.com.


