

Ten of the eleven S&P sectors finished higher for the week ending 07/02/21, states Bonnie Gortler of bonniegortler.com.
Four gained more than the SPDR S&P 500 ETF Trust (SPY), up 1.67%. Technology (XLK) and Healthcare (XLV) were the leading sectors, +3.19% and +2.06%, while Energy (XLE) and Financials (XLF) lagged. There was no follow-through to their previous week’s solid gains up only +0.03% and down -1.17%.
S&P SPDR Sector ETFs Performance Summary
Week Ending 7/02/21 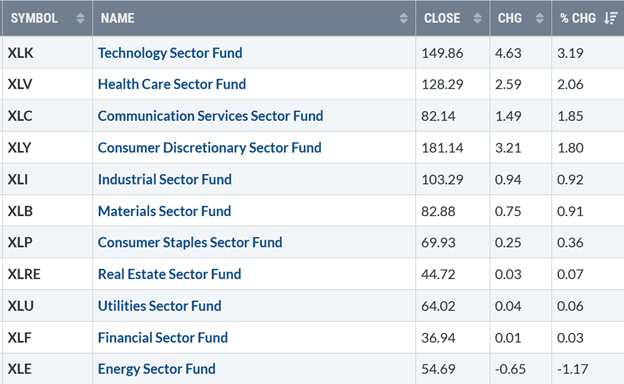
Source: Stockcharts.com
10-Year Treasury yields fell to 1.43%, its lowest level since early March, helping fuel the technology sector. A further decline will likely attract more buying into growth stocks and more profit-taking in value stocks, especially financials. On the other hand, rising rates would slow the gains of growth stocks.
Yields could fall to 1.27%, its lower channel objective (Figure 1 in green) over the next several weeks to months if yields stay below 1.57%.
Figure 1: 10-Year Treasury Yields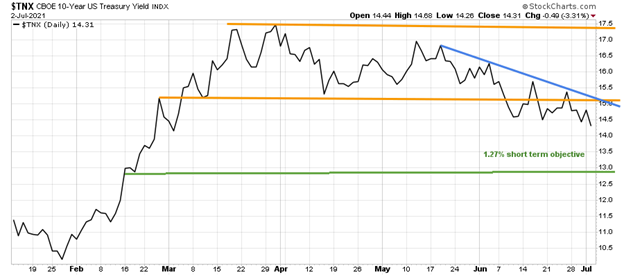
Source: Stockcharts.com
The S&P 500 closed Friday at an all-time high, continuing its seven-day winning streak. Last week, the Dow gained +1.02%, S&P 500 up +1.67%, and Nasdaq gained +1.94%. The Russell 2000 index lagged, down -1.23%, with no follow-through to last week’s solid gains.
Weekly market breadth was not as strong as it has been in recent weeks. The New York Stock Exchange Index (NYSE) had 1757 advances and 1734 declines. Nasdaq had negative breadth, 1969 advances, and 2657 declines.
Figure 2: Daily New York Stock Exchange (NYSE) New Lows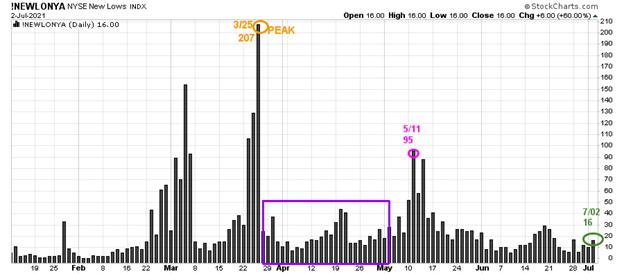
Source: Stockcharts.com
On 3/25, the NYSE new lows peaked at 207 (orange circle) and immediately contracted (purple rectangle). On 5/11, new lows on NYSE jumped to 95, their highest level since late March flashing a warning sign, but new lows immediately dropped. New lows rose slightly to 16 (green circle), last week remaining in the lowest-risk zone where stock prices tend to rise.
Watching new lows on the New York Stock exchange is a simple technical tool that helps awareness about the immediate trend's direction. In my book, Journey to Wealth, when the new lows are below 25, the market is very strong (very low risk and prices tend to rise). When new lows are between 25 and 50, risk is low, and the odds of a further rally are likely.
If new lows begin to expand and have a succession of days over 95 (the 5/11 high), this will imply more risk and a shift in trend. On the other hand, if they remain low, the odds favor the resumption of the rally.
“Successful people are simply those with successful habits.” ~Brian Tracy
ETFs to Monitor
Figure 3: Performance week of 6/25/21 - 07/2/21 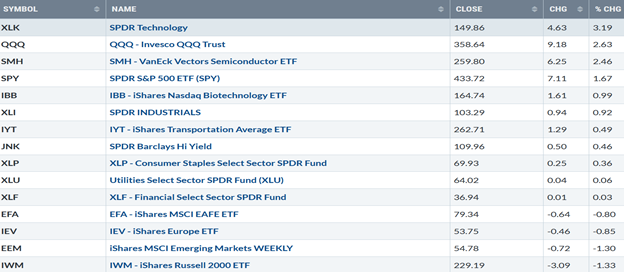
Source: Stockcharts.com
Positives
- The trend is up, with key averages such as S&P 500, Nasdaq 100, Dow Industrials, and Russell 3000 hit all-time highs.
- Hi-Yield (JNK) and open-end high-yield corporate bond funds rose last week, remain in an uptrend, and closed at their highs (Figure 4).
- The Transportation Average (IYT) broke its June downtrend and gave a new MACD buy (Figure:7).
Negatives
- New highs on the Nasdaq and New York are not expanding and remain below their 2021 new highs (Figure 6).
- Market sentiment based on CNN Fear and Greed Index (contrary indicator) rose from 44 to 45 last week to (Figure:5), now neutral no longer showing fear. Other market sentiment indicators are showing signs of optimism.
- Volume patterns on the New York Index and Nasdaq are not confirming the highs should be watched closely.
- IWM was down -1.3%, closing below support at 230.00 as other major averages rose to new highs. The weekly relative strength ratio (Figure:11) compared to the S&P 500 (IWM/SPY) turned down, unable to break out to the upside.
- Weakness in Emerging Markets (EEM) (Figure:9), and other international markets, including Europe (IEV), failed to break out to the upside and no longer supporting the US market.
Figure 4: LORD Abbett High Yield Fund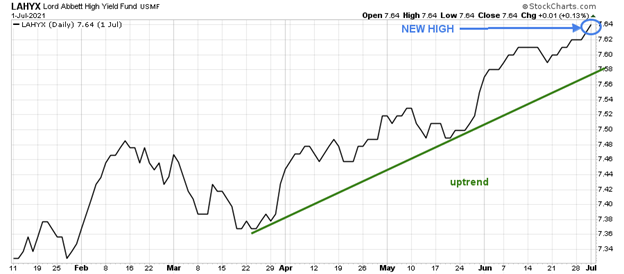
Source: Stockcharts.com
Figure 5: CNN Fear and Greed Index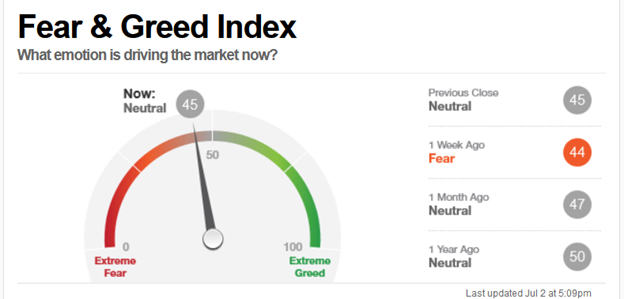
Source: CNN Business
Figure 6: Nasdaq New Highs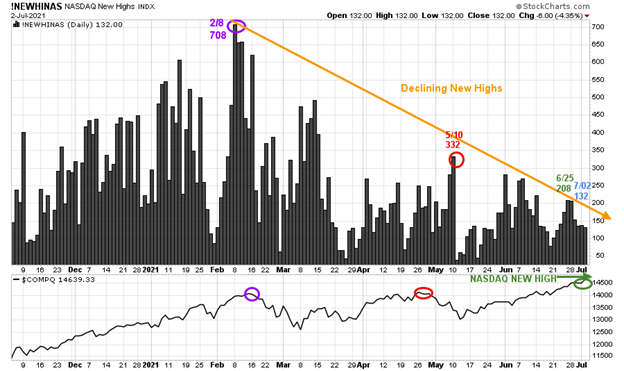
Source: Stockcharts.com
Despite the new high in the Nasdaq, stocks making new highs were only 132, decreasing and closing below the peak reading of 708 set on 2/8. Watch if new highs begins to increase or continue lower. If they can expand to over 332, this will be a clue Nasdaq can sustain further gains in the near term. On the other hand, if they falter, that would imply the Nasdaq rally is likely to stall.
Figure 7: Ishares Transportation Average (IYT)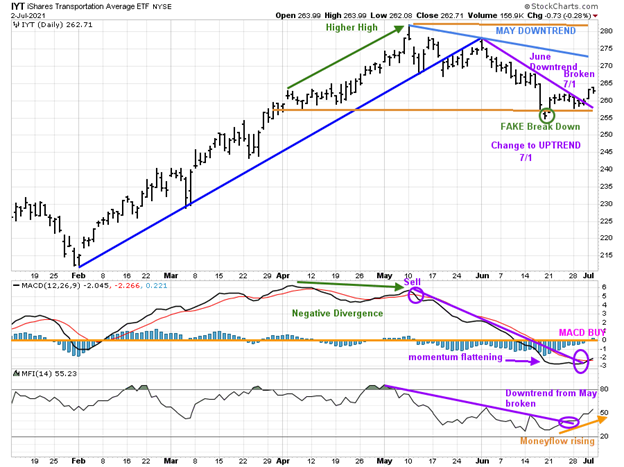
Source: Stockcharts.com
The top chart is the Transportation Average (IYT), which peaked in May. The short-term trend changed to up now that the June downtrend was broken (purple line). However, there is more work to do. IYT has not confirmed the Dow new high, and the downtrend from May remains in effect.
It would be a bullish sign if IYT could begin to outperform the S&P 500 and close above 265.00 and then gain strength to over 275.00, breaking the May downtrend.
On the other hand, a close below 255.46 would be bearish and imply weakness that could accelerate and ultimately lead the broad market lower.
MACD (middle chart) is now on a buy after downside momentum slowed and MACD turned up. If IYT could break the MACD May downtrend, it would be bullish for the near term.
The lower chart is Money Flow (MF). Its positive Money Flow is rising and already broke the May downtrend (purple line), implying investors are shifting assets to Transports despite the weakness in the sector.
Figure 8: CBOE Volatility Index (VIX)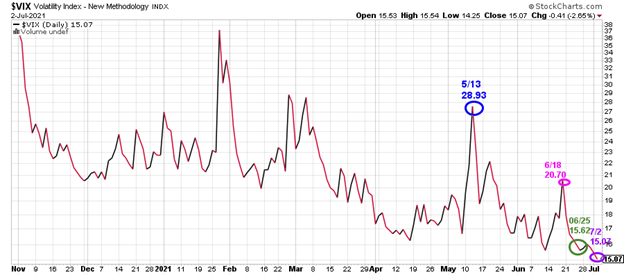
Source: Stockcharts.com
As measured by the CBOE Volatility Index (VIX), fear continued to fade among investors and changed to complacency. VIX fell last week to 15.07, its lowest level since 2/20/20 and below its long-term average under 20.00. A close above the 6/18 close of 20.70 would imply an increase in day-to-day fluctuations and a warning a correction could begin.
ETFs to Monitor 6/28 – 7/2
Figure 9: iShares MSCI Emerging Markets (EEM) 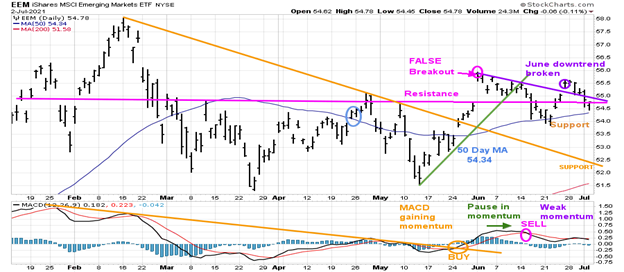
Source: Stockcharts.com
EEM broke above resistance, on 6/1 a false breakout (pink circle), breaking the uptrend from May (green line). EEM since June had no follow-through in either direction even after breaking the June downtrend. However, EEM closed above 54.50, old resistance, and remains above its rising 50-Day MA at 54.34.
It was disappointing EEM was down -1.3%, closing at 54.78 as EEM appeared ready to rise towards the upper objective of 58.50. Still, now it’s in jeopardy of falling below support as MACD shows signs of momentum weakening.
Support is at 54.20, followed by 52.50. Resistance is 56.00. Further weakness in EEM is likely to carry over into other global markets and no longer be a catalyst to fuel the US market. The lower chart is MACD, a measure of momentum. MACD remains on a sell. MACD missed getting oversold, below 0 to be in a position to generate a new buy. More time is needed to see if MACD turns up or if the momentum continues to weaken.
Figure 10: Daily iShares Russell 2000 (IWM) Price (Top) and 12-26-9 MACD (Bottom) 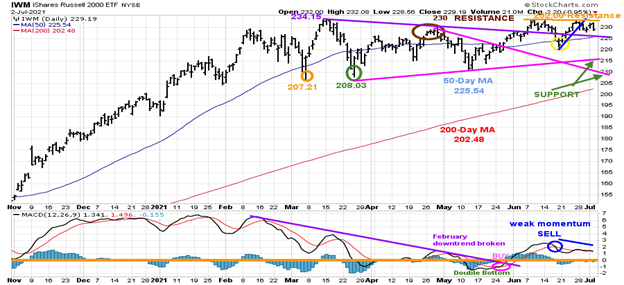
Source: Stockcharts.com
The top portion of the chart is the daily iShares Russell 2000 Index ETF (IWM), the benchmark for small-cap stocks, with a 50-day moving average (MA) (blue line) and 200-day moving average (MA), that traders watch and use to define trends.
IWM made a low on 3/5 at 207.21 (orange circle), then peaked at 234.15. On 3/25, IWM successfully tested its low at 208.03 (green circle) and then stalled at 230.00, key resistance (brown circle).
IWM closed at 229.19, down -1.3%, stalling after showing strength the previous week. It’s not a good sign IWM failed to make a high and closed below old resistance at 230.00. However, there is some hope if IWM can remain above its short-term downtrend from April (purple line).
Resistance is between 232.00 and 234.00. Support is 225.00. If IWM closes below 225.00, the next support area is between 210.00 and 215.00 (green arrows). A close below the March low at 207.21 would imply an increased risk of a potential top made and a decline to 185.00.
The bottom half of the chart is MACD (12, 26, 9), a measure of momentum. MACD remains on a sell, losing momentum. More weakness in MACD would imply IWM is likely to test the support between 210.00 and 215.00.
Figure 11: Weekly iShares Russell 2000/S&P 500 (IWM/SPY) Relative Strength Ratio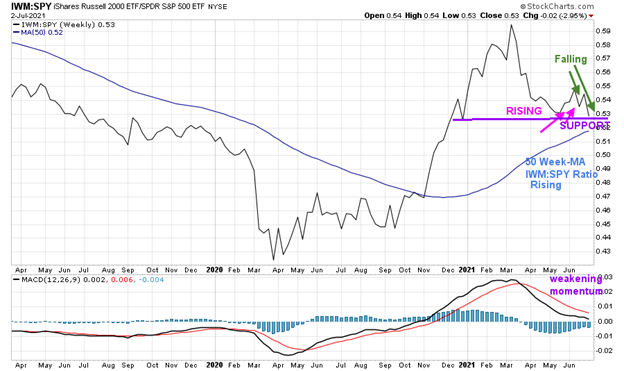
Source: Stockcharts.com
The weekly IWM /SPY ratio is flipping back and forth, now falling but remains above the 50-week moving average (MA), which continues to rise. However, it’s not a positive sign MACD has turned down.
If IWM gains strength and is stronger than the S&P 500 (SPY), then IWM could potentially outperform the S&P 500 in the coming weeks to months. Unless IWM turns up early in the week, I expect IWM to remain weaker than the S&P 500.
Figure 12: Daily Invesco QQQ Trust Nasdaq (QQQ) Price (Top) and 12-26-9 MACD bottom)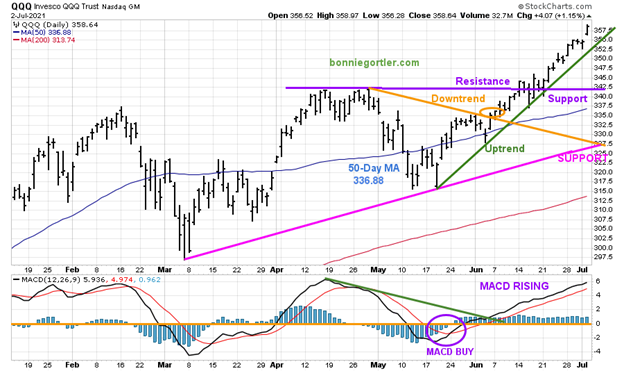
Source: Stockcharts.com
The top part of the chart shows the daily Invesco QQQ, an exchange-traded fund based on the Nasdaq 100 Index with its 50-day moving average and 200-day moving average. QQQ broke its May downtrend (orange circle) on 6/4 and is still in an uptrend.
QQQ gained 2.6% for the week leading the overall market higher. The upside objective remains 370.00. A close below 350.00 would break the uptrend and reduce the odds of reaching 370.00.
Support is at 342.50, followed by 335.00. A close below support at 327.50 would break the uptrend from March and increase the odds the decline will accelerate and test the March lows.
The bottom chart is MACD (12, 26, 9), a measure of momentum. MACD remains on a buy. Be alert if MACD starts to turn down and then generates a sell, implying that the easy money is over and risk increases.
Figure 13: Daily Vaneck Vectors Semiconductor (SMH) Price (Top) and 12-26-9 MACD (Bottom)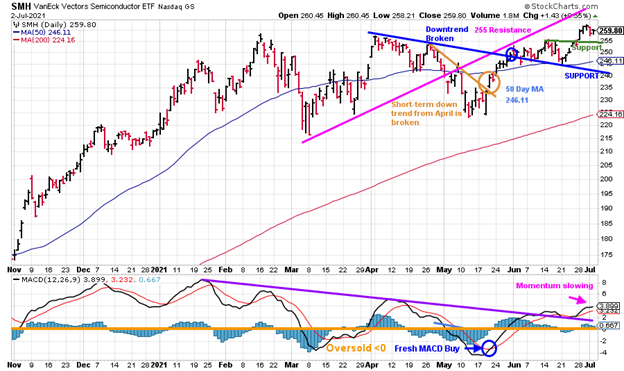
Source: Stockcharts.com
The top chart shows Semiconductors (SMH). Semiconductors have risen since breaking their April downtrend (blue line) with an upside objective to 276.00. SMH closed on 7/2 at 259.80, up +2.5% its second week of gained over 2% and above previous resistance of 255.00. First support is at 255.00 followed by 240.00.
The lower chart is MACD, a measure of momentum. MACD is on a buy holding above the downtrend from January (purple line), turning up last week. MACD made a higher high, confirming the high in SMH. Bulls remain in control. However, watch if MACD momentum continues to slow or gains momentum.
Figure 14: ARKK Innovation ETF (ARK)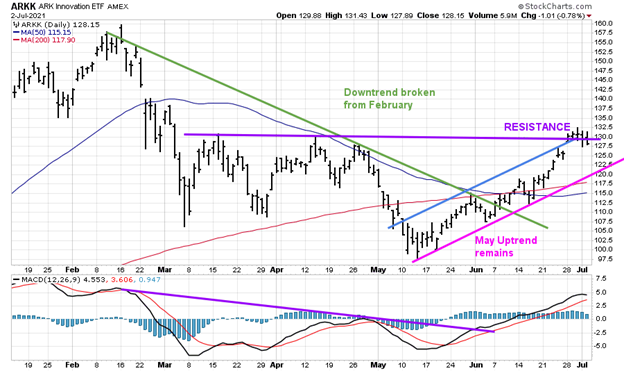
Source: Stockcharts.com
I like to watch the movement of ARKK Innovation (ARKK) to see the risk appetite of traders. ARKK was in a downtrend but shifted in May to an uptrend. ARKK bottomed in May and continues to have a bullish pattern of higher lows and higher highs for now. However, after closing above resistance at 130.00 for two days, ARKK turned down and closed below.
Support is at 120.00. Resistance is at 132.50. Further strength in ARKK will be a clue of traders' risk appetite of growth stocks in the short term.
Summing Up:
The trend remains up. However, Russell 2000 (IWM) was down for the week, not participating in the rally, which is somewhat disturbing. Major averages made record highs, but market breadth weakened and bears watching. Earnings season is starting, which is likely to increase volatility in the coming months. I am continuing to give the benefit of the doubt to the bulls for now. However, I’m more concerned this week than last despite the clear uptrend. Momentum patterns are weakening as the market goes to new highs. Few and fewer stocks are participating in the rally. Have an exit plan ready if there is a change in trend, and volatility increases quickly. The key closing numbers to watch for a major trend change are below 207.21 for IWM and below 327.50 for QQQ.
Remember to manage your risk, and your wealth will grow.
I would love to hear from you. If you have any questions or comments or would like to talk about the market, email me at Bonnie@Bonniegortler.com.
Learn more about Bonnie Gortler at BonnieGortler.com
Disclaimer: Although the information is made with a sincere effort for accuracy, it is not guaranteed that the information provided is a statement of fact. Nor can we guarantee the results of following any of the recommendations made herein. Readers are encouraged to meet with their own advisors to consider the suitability of investments for their own particular situations and for determination of their own risk levels. Past performance does not guarantee any future results.


