

A handful of key charts suddenly are reacting to price and time cycles, says Jeff Greenblatt of Lucas Wave International.
Could this be the one for keeps? Nobody knows for sure but the higher probability they are is back on the table. At the middle of October and the stock market is still in decent shape. Is that about to change?
Let’s take a look. The Dow has been weakening lately, just not enough for the mainstream media to take notice. That could be good for bears who like to fade and feed under the cover of complacency. The media and public only wake up after investors get spanked. In the current environment it will likely take a Dow down a thousand day for the crowd to take notice. There are two noteworthy points on the Dow chart right now. First is the secondary high on September 27 had a slash line of 1.39 and 71%. By itself that didn’t mean much but through the process of replication, the Dow suddenly started rolling over 39 days off the high. If you look at the trajectory the pattern was on prior to this week, there seemed to be a reasonable chance for the price action to tag a confluence of trend lines which intersected around 35285. We are roughly a thousand points lower as of this writing but that’s not the point.
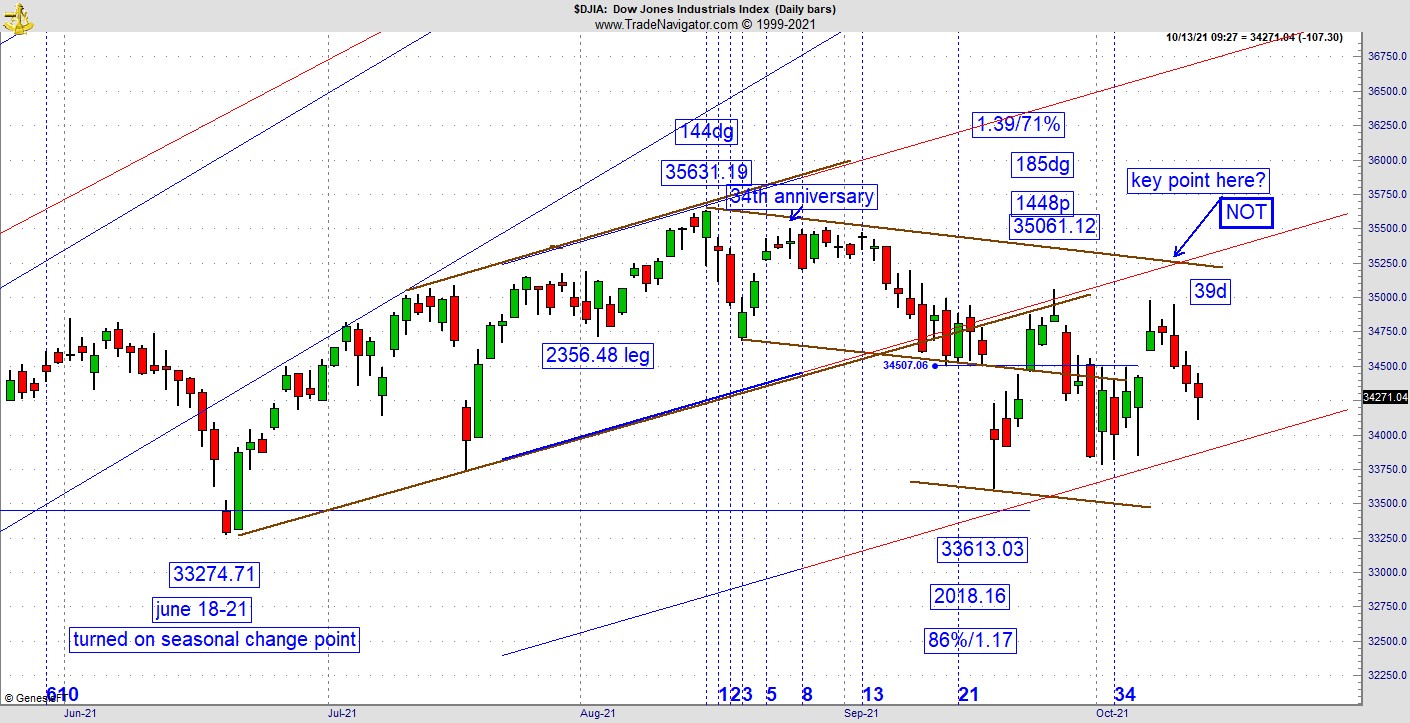
Is the market so weak it couldn’t drag itself to that juncture? I tend to agree with other writers on this site who portray the pattern as a consolidation. One good reason for that could be the authorities avoided a storm by raising the debt ceiling. That was a no-brainer. But there are still plenty of other issues out there as I discussed last week.
Labor Secretary Marty Walsh called the 194,000 jobs number last week, “not the best number.” I would say so. The experts predicted 500,000 and by the rate people are getting fired from their jobs these days, they should be fortunate any jobs were added. I am one of the biggest proponents of trading the pattern as we see it, but it is a wonder how the market stays up with so much negativity going on.
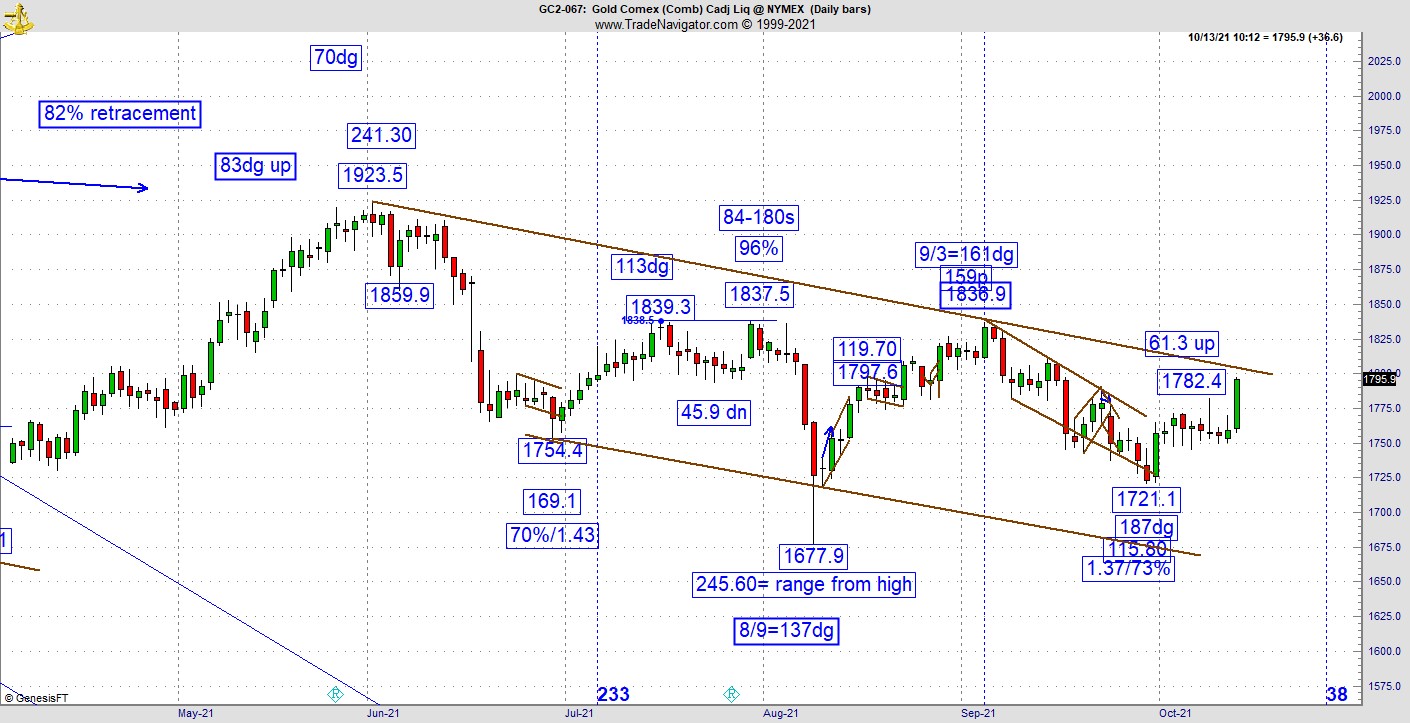
Perhaps gold bugs finally figured this out. This is the most bullish I’ve seen gold in a while. Why? I could tell you it’s the giant-sized green bar from Wednesday but that’s too obvious. Look at the chart carefully and you’ll see one set of replication in the process of being validated while the other is negated. The prior high for gold was September 3, which was the 161dg vibrational day of the year. It pulled back to create a 1.37/73% slash line (inverse and retracement values to the prior leg up), which replicated the August 9th low, which came in on the 137dg vibrational day. Eventually we knew one of these had to spoil. The high from last Friday was 61.3 points up, which lined up with the high vibrational day from September 3. I thought it could have consolidated more but the 61.3 leg up has been violated, which means the bulls now have the upper hand. If it can take out the overhead trend line, chances are there is a lot of gas left in the tank.
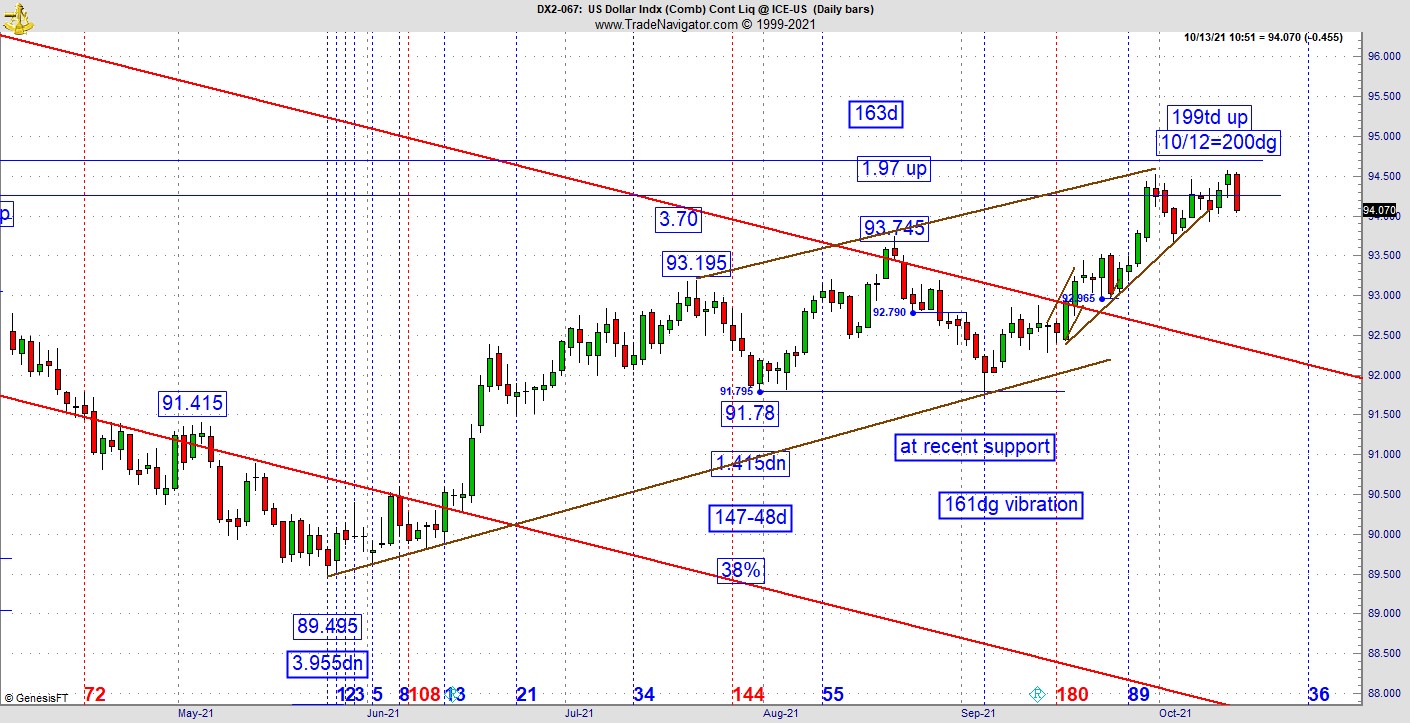
For the greenback, it suddenly ran into trouble as the rally from January is 199 trading days up while October 12 is the 200dg vibrational day of the year. From the May 25th low where this latest rally started, it's 100 days up. None of this means anything without the red candle showing the pattern could be rolling over. Consider this an early warning system. More aggressive traders may decide to take experimental shorts here even as it appears many market participants are starting to pile into gold. The takeaway here is conditions are suddenly ripe for the dollar to roll over.
Let’s explore the world of educated speculation. I’ve been talking about the greenback 161-month window from the 08 bottom for a while now. We know the heart of the window is from August thru October. Under one scenario, had the dollar peaked in August, which it almost did, the pattern could’ve hit a high and a low in this season. That would’ve implied a major storm and a crash. Several reliable outlets I followed have suggested nations are colluding together to dump the greenback at the same time. It hasn’t happened yet for whatever reason, which is likely classified.
What I can tell you is instead of a low, it’s still possible October could produce a high in the US dollar and if we are seeing it now, it likely means the beginning of a long and painful road as all the money creation catches up to us. It will catch up to us, its not a matter of if but when.
If there is one theme as a takeaway today for the bears this is it. If the investing/trading climate is changing, its doing so very quietly. That’s usually how corrections work.
For more information about Jeff Greenblatt, visit Lucaswaveinternational.com.


