

Inflation anxieties continue to remain at the top of bond investors’ minds. The Consumer Price Index (CPI) clocked a multiyear of record of 6.2% on November 10, spurring a rise in yields, states Garrett DeSimone of OptionMetrics.
Bond yields increase and bond prices fall with rising inflation, as bond traders account for the real value of lending. Although the short-term inflation swell has created a sticker shock from consumers on goods, ranging from gas to eggs, debates continue among economists regarding how long the inflationary environment will last.
The implied volatility (IV) skew on treasury options provides an indicator for bond investor sentiment and the downside price risks posed by unexpected inflation. The IV skew measures the relative expensiveness of out-of-the-money (OTM) put options to OTM call options, and provides an indication of how traders weigh upside versus downside risks.
The typical skew observed in bond markets is centered around zero, signifying investors’ preference for risks between rising and falling yields are balanced. This has not been the case since late July. The chart below demonstrates the sustained rise in 5-year and 10-year treasury skews to a level of around 50 basis points. This number is significant in a historical context. The 10-year value high of 0.057 (shown recently, in the graph below) ranks in the 90th percentile of daily skew values since 2017.
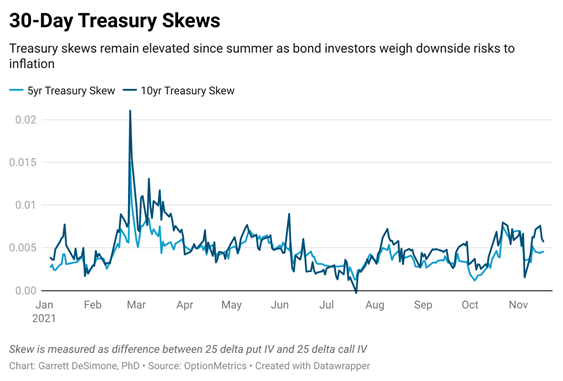
Large skews generally serve as a bearish indicator for future bond prices to decrease, with traders raising the price of OTM put options in response to higher anticipated inflation and expedited rate increases from the Federal Reserve. If skews continue to remain elevated, it’s a continued warning to investors that inflation is no longer transitory.
Garrett DeSimone, PhD is Head of Quantitative Research at OptionMetrics, LLC. His company is an options database and analytics provider for institutional and retail investors and academic researchers that has covered every US strike and expiration option on over 10,000 underlying stocks and indices since 1996. It is online at www.optionmetrics.com.


