

For the week, two of the eleven S&P SPDR sectors rose, states Bonnie Gortler of bonniegortler.com.
Real Estate (XLRE) and Consumer Staples (XLP) were the best performing sectors, while Energy (XLE) and Communication Services (XLC) were the weakest. The SPDR S&P 500 ETF Trust (SPY) was down -2.74 %.
4/15/22 – 4/22/22 S&P SPDR Sector ETFs Performance Summary
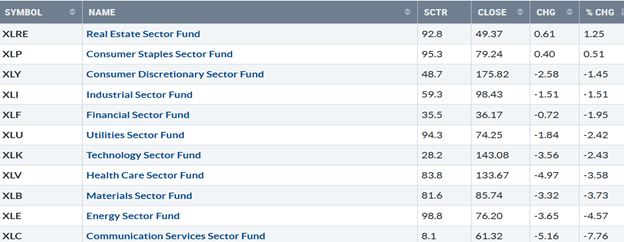
Source: Stockcharts.com
Figure 2: Bonnie's Mix of ETFs Performance Summary 4/15/22 – 4/22/22
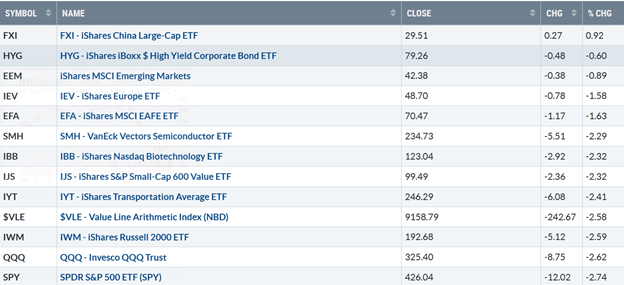
Source: Stockcharts.com
Last week, there was no place to hide except in China (FXI). A broad decline for all the ETFs I watch closely, with both growth and value falling and most global markets. Semiconductors and Technology continued to trend lower as yields rose again.
Figure 3: S&P SPDR Sector One Day Performance 04/22/22
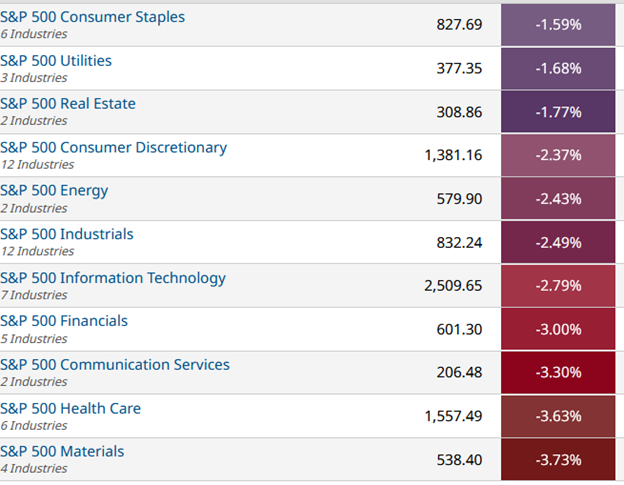
Source: barchart.com
Friday was painful, the S&P 500 (SPX) plummeted, closing at 4271.78 -2.77%, and all 11 S&P SPDR Sectors were down as the decline accelerated. There was no sector to rotate money into; even the defensive sectors, Energy (XLRE), Utilities (XLU), and Consumer (XLP), the strongest sectors in April, were lower.
April tends to be a strong month for the stock market historically. However, so far not the case in 2022. Technical indicators are short-term oversold, and fear is rising again, a sign a potential bottom may be nearing over the next several weeks.
Figure 4: CNBC Fear & Greed Index 4/22/22
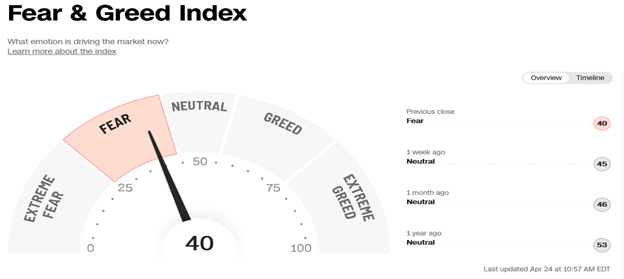
Source cnn.com
Last week the CNBC Fear and Greed Index (a contrary indicator) closed in the fear zone after being neutral the previous week and the past month, closing at 40. However, the index is not yet in extreme fear, which may or may not occur before the final market bottom.
Figure 5: AAII Investor Sentiment Survey Week Ending 4/20/22
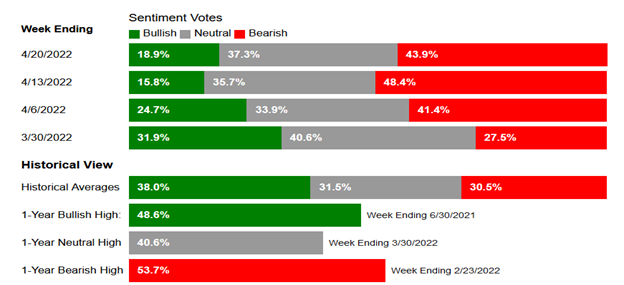
Source aaii.com/sentimentsurvey
AAII Sentiment Survey (a contrary indicator) showed bullish sentiment below 20% for the second week in a row, the first time since May 2016. Optimism remains below its historical average of 38.0% for the 22nd consecutive week.
Figure 6: UST 10-Year Bond Yields Daily
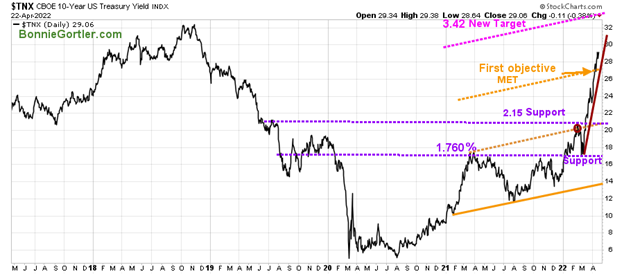
Source: Stockcharts.com
The 10-Year US Treasury yields continued to climb last week to three-year highs closing at 2.906%, with an upside target of 3.42.
Figure 7: UST 5-Year Bond Yields Daily
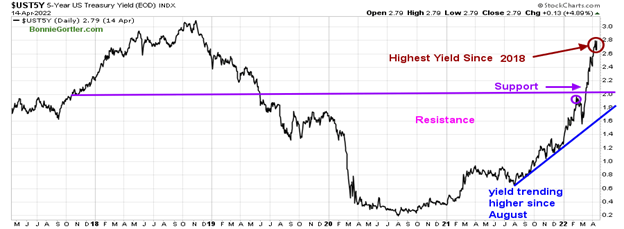
Source: Stockcharts.com
The Five-Year US Treasury yield rose, closing at 2.94%, the highest yield since late 2018. Rates continuing to rise did not help the stock market.
The Dow (DJI) fell -1.86% for the week, the least of the major averages. The S&P 500 was down -2.75%, Nasdaq (NDX) fell -3.83%, while the Russell 2000 Index (RUT) declined -3.21%. The Value Line Arithmetic Index (a mix of approximately 1700 stocks) also was under pressure, down -2.59%.
Weekly market breadth remained negative for the New York Stock Exchange Index (NYSE) and Nasdaq. The NYSE had 1021 advances and 2546 declines, with 88 new highs and 649 new lows. There were 1592 advances and 30714 declines on the Nasdaq, with 213 new highs and 1022 new lows.
Figure 8: NYSE Cumulative Advance-Decline Line (Top) and NYSE Index (Bottom)
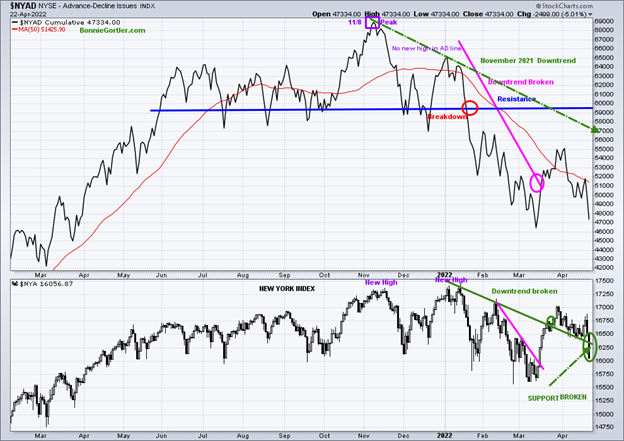
Source: Stockcharts.com
The New York Index made a new high in November 2021 and in January 2022 (bottom chart), unconfirmed by the NYSE AD line, which peaked on 11/8/21 (purple rectangle top chart).
Since last November, the NYSE A/D Line has remained in a downtrend (green dotted line top chart).
In March, the AD Line and New York Index broke their short-term downtrends (pink line top and bottom chart). However, breadth has weakened considerably in April, turning down, failing to get above resistance (blue line top chart), and testing the March low.
Improved market breadth is needed for a successful bottom and change of trend. Keep a close eye for several days of more advances than declines and new lows contracting below 150 for the first sign of a potential upside reversal.
Figure 9: CBOE Volatility Index VIX
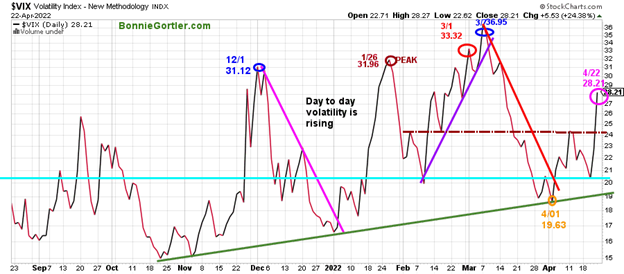
Source: Stockcharts.com
The CBOE Volatility Index (VIX), a measure of fear, has been trading above 20.00 for most of 2022. In January, VIX made a high at 31.96 on 1/26 (brown circle), on 3/1 at 33.32 (red circle), and 36.95 on 3/7 (blue circle).
On 4/22, VIX rose sharply up 24.3%, closing at 28.21 after only a few weeks ago (orange circle) below 20 at 19.63. Expect more day-to-day volatility until VIX closes at a minimum below 24.00. If you are day trading, adjust your size of trades to be smaller to manage risk.
Figure 10: Daily New York Stock Exchange (NYSE) New Lows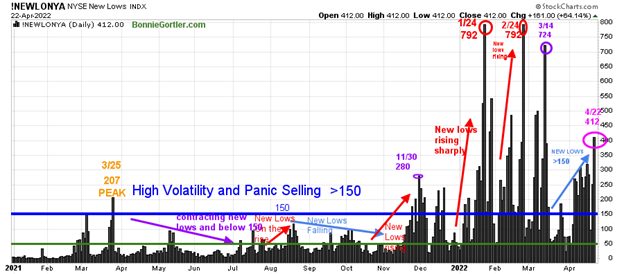
Source: Stockcharts.com
Watching new lows on the New York Stock Exchange is a simple technical tool that helps awareness of the immediate trend's direction.
New lows warned of a potential sharp pullback, high volatility, and "panic selling" for most of 2022, closing above 150. Learn more about the significance of new lows in my book, Journey to Wealth, published on Amazon. Here is an excerpt: "When new lows are above 150, the market is negative, higher risk, and selling is taking place. Sometimes it could be severe, and sometimes on a very nasty day, you can have 'panic selling,' and big wild swings (high volatility) to the downside may occur."
As the market sold off in January, new lows rose sharply, peaking at 792 on 1/24 (red circle), and then contracted but not enough to be in a low-risk zone before rising again on 2/24 at 792, matching the 1/24 peak. In March, things were looking better as new lows fell below 150, and a rally began, but it was short.
New lows closed at 412 on 4/22 (pink circle), remaining above 150, not a positive sign in the near term. Risk is high of further downside in the near term until they contract to below 150 and then fall between 25 and 50.
Figure 11: Daily Nasdaq Advance-Decline Line
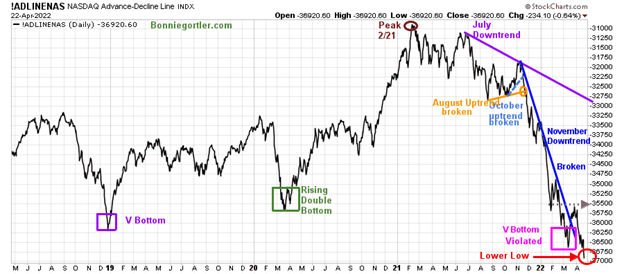
Source: Stockcharts.com
The daily Nasdaq advance-decline line peaked in February 2021 (brown circle), followed by failed attempts to make a new high. After breaking the October uptrend (blue dotted line), the Nasdaq AD-Line made a series of lower highs and lower lows in November, December, and January and trended down.
The July 2021 downtrend (purple line) remains. After making a lower low (pink rectangle) earlier in the month, a V bottom identical to December 2019 (purple rectangle) formed. The broken downtrend from November (blue) penetrated was a positive sign.
However, the AD line turned down with continued negative breadth, and a lower low was made (red circle) on Friday, implying further downside is likely.
Figure 12: Daily iShares Russell 2000 (IWM) Price (Top) and 12-26-9 MACD (Middle) and Money Flow (Bottom)
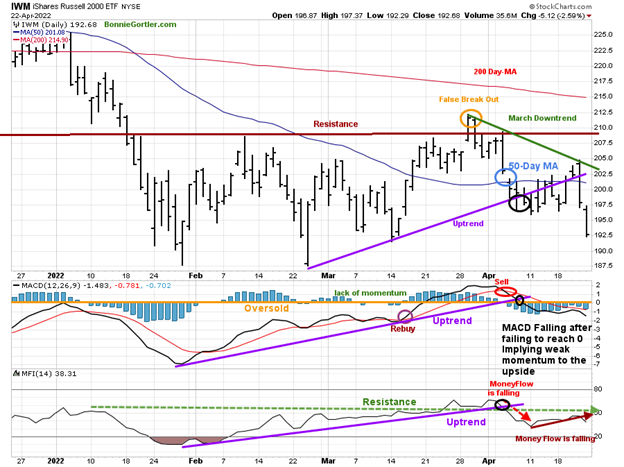
Source: Stockcharts.com.
The top portion of the chart is the daily iShares Russell 2000 Index ETF (IWM), the benchmark for small-cap stocks, with a 50-Day Moving Average (MA) (blue line) and 200-Day Moving Average (MA) that traders watch and use to define trends.
IWM had the potential to break out to the upside, but in late March, IWM had a failed breakout above resistance at 210.00 (orange circle) and turned lower, forming a downtrend. IWM closed below the 50-Day MA (light blue circle), closing at 192.68 and under 195.00 support down -2.59%.
Short-term resistance is 195.00, 205.00, 210.00, and 212.50. Support remains at 192.00, followed by 187.00. MACD (middle chart) remains on a sell and is falling as downside momentum increases.
Money Flow (lower chart) broke the uptrend in early April; however, it is negative after turning down again. Note: IWM for the intermediate term (weekly chart not shown) stalled under resistance at 210.00 after generating a buy. However, it continues to be disturbing that the downtrend in MACD remains.
Nasdaq remains weak in a short-term trend down.
Figure 13: Daily Invesco QQQ Trust (QQQ) Price (Top) and 12-26-9 MACD (Bottom)
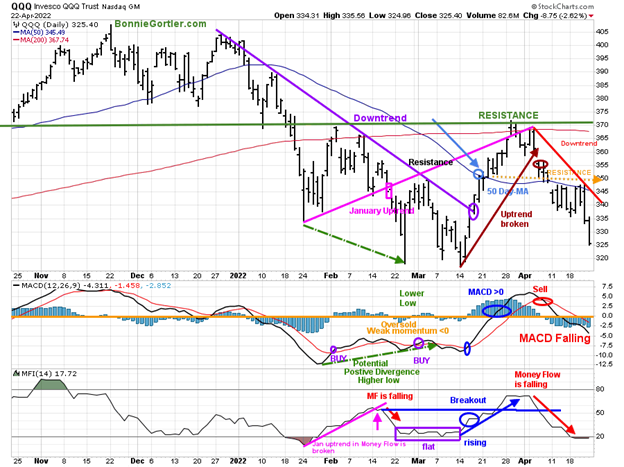
Source: Stockcharts.com
The chart shows the daily Invesco QQQ (QQQ), an exchange-traded fund based on the Nasdaq 100 Index with its 50 and 200-Day Moving Average. QQQ accelerated lower after breaking the January uptrend (pink rectangle), penetrating the January lows.
Last week QQQ closed below support of 330.00, falling 2.67%, closing at 325.40, remaining below its 50-Day and 200-Day Moving Average. The March uptrend (brown line) was broken at 355.00, and QQQ has been under selling pressure.
The short-term trend remains down (red line) with resistance at 335.00 345.00, 350, followed by 370.00. Support is at 320.00. The middle chart is MACD (12, 26, 9), a measure of momentum remains on a sell and falling.
Money Flow (lower chart) continues down after breaking out of its sideways trading range after reaching its highest level since November 2021. With the short-term trend down, caution is recommended until the price breaks its downtrend and momentum and money flow turn up.
Figure 14: Van Eck Semiconductors (SMH) Daily Price (Top), 12-26-9 MACD (Middle), and Money Flow (Bottom)
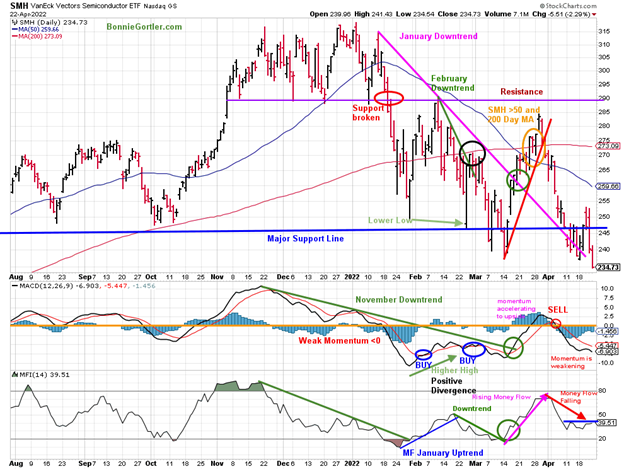
Stockcharts.com
In late January, Semiconductors (SMH) support was broken (red circle) and then fell sharply but held the October 2021 lows. SMH then rallied but turned down again, closing below support at 240.00 on 3/14/22, a false breakdown.
SMH broke the March uptrend (red line) after failing to get above resistance and remains out of favor, down for the fourth week in a row, down -2.29% at 234.73 below the March lows. The next support is at 220.00. Resistance is 245.00, followed by 260.00. MACD (middle chart) remains on a sell (red circle) and falls.
Money Flow (lower chart) has been trending sideways since April 11. Watch for Money Flow turning higher and showing relative strength outperforming QQQ. Until MACD turns up, it remains risky to bottom fish at this time.
Figure 15: I Shares Hi-Yield Corporate Bond (HYG) (Top), and 12-26-9 MACD (Bottom)
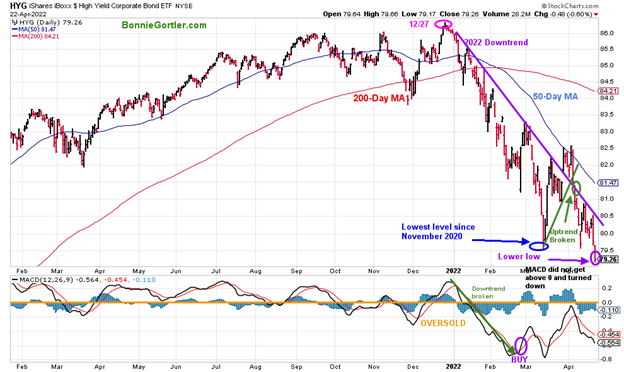
Source: Stockcharts.com
Hi-Yield Bonds (HYG) peaked on 12/27/21, appearing to stabilize in late February but reversed lower in March, reaching their lowest level since November 2020 (blue circle). HYG continues not to show much strength after breaking the downtrend in early April, a false breakout.
HYG remains below its 50-Day MA and closed at a new low for 2022 at 79.26, -0.60% for the week.
MACD did not get above zero and turned down, implying weak momentum. More base building is needed. Monitor the performance of HYG. Until HYG shows strength closing above 80.50 and then 81.10, HYG is likely to trend lower. More selling pressure on the financial sector despite rising yields.
Figure 16: Financial Select SPDR (XLF) (Top) and 12-26-9 MACD (Bottom)
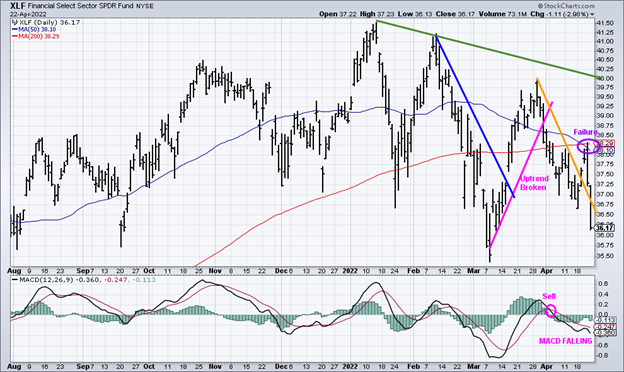
Source: Stockcharts.com
The 2022 downtrend in Financials (XLF) remains.
After breaking its March uptrend (pink line), XLF moved lower, followed by XLF breaking its March downtrend that failed at its 50 and 200-Day-MA (purple circle). Even though rates rose, Financials (XLF) fell by -1.95% last week. MACD remains on a sell, below zero, and falling. Until XLF trades above 38.75 and MACD turns up, the risk remains of further downside.
Key Support Below on S&P 500 (SPY):
60-Minute SPDR S&P 500 (SPY)
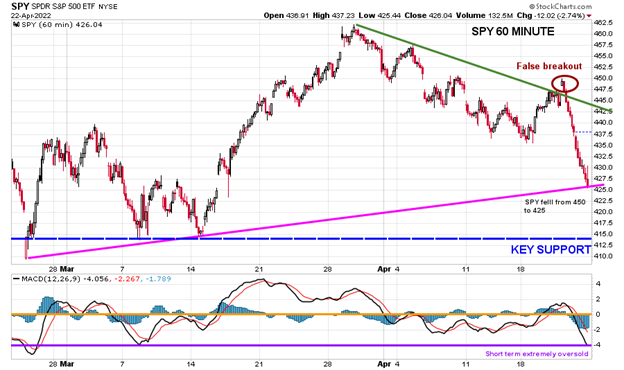
Source: Stockcharts.com
Stock market weakness accelerated on 4/21 following Fed Chair Powell backing a 50-basis point rate hike in May. The SPY fell from 450.00 to 425.00, a 5.56% decline.
On Friday, all S&P SPDR sectors also fell sharply, closing near session lows. The short term is now highly oversold and due for a bounce early in the week. Be alert to a potential upside reversal where up to down volume on the NYSE closes at 90%, signaling the worst of the decline is likely over.
Summing Up:
April, one of the best performing months historically, is so far not the case in 2022. The short-term trend remains down, with momentum patterns not yet favorable supporting a sustainable rally. Be alert to a short-term bounce early in the week with the technical indicators oversold on an hourly and daily time frame. A slew of earnings will be reported this week, including Microsoft, Apple, and Amazon. If they are positive, the bulls may come out of hiding. But, for now, the bears remain clearly in control until proven otherwise.
Remember to manage your risk, and your wealth will grow.
I would love to hear from you. If you have any questions or comments or would like to talk about the market, click here or email me at Bonnie@Bonniegortler.com
Disclaimer: Although the information is made with a sincere effort for accuracy, it is not guaranteed that the information provided is a statement of fact. Nor can we guarantee the results of following any of the recommendations made herein. Readers are encouraged to meet with their advisors to consider the suitability of investments for their own particular situations and for determination of their own risk levels. Past performance does not guarantee any future results.


