

A sound investment strategy takes advantage of the economic environment, states George Dagnino, chairman of Peter Dag Strategic Money Management.
The economic environment drives the relative performance of investments. The business cycle tells which stocks should be in your portfolio: high-beta vs low volatility.
The Main Forces Driving the Business Cycle
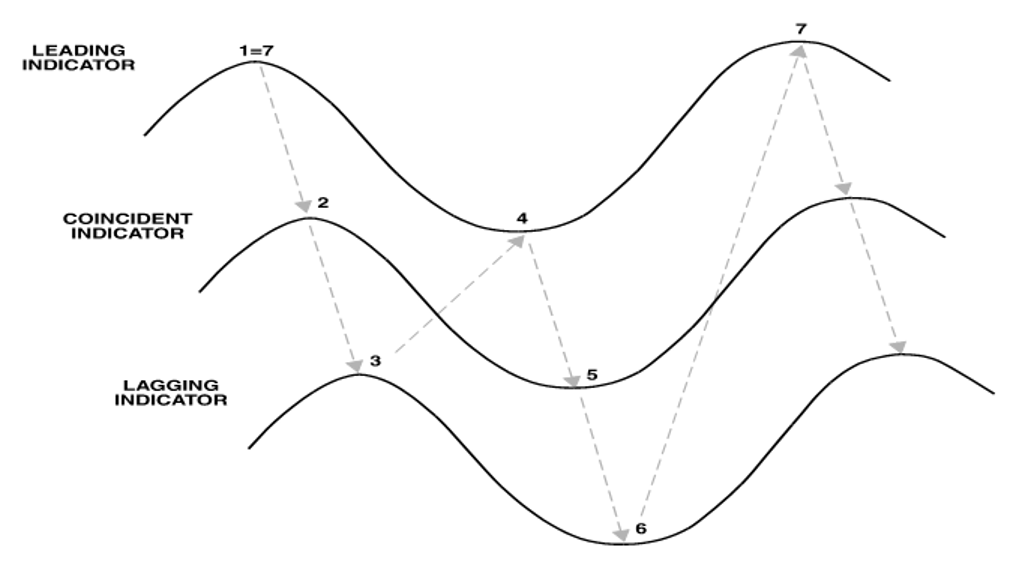
There are three main types of economic indicators: leading, coincident, and lagging. The lagging indicators are the most important ones for investors because they determine the length of the business cycle and the severity of the economic correction needed to bring them down so the economy can expand again.
Inflation, interest rates, and labor costs are the most important lagging indicators.
A rise in inflation reduces consumers’ purchasing power. The rise in interest rates makes purchases of anything less affordable—housing and autos in particular. Rising labor costs hinder profitability. Consumers react to the rise in inflation and interest rates by first cutting the purchase of big-ticket items. This is also the time consumer confidence in the University of Michigan declines sharply. The slowdown in housing and auto sales are the first developments reflecting the economy is downshifting. Such slowdowns are reflected in equity prices. Coincident indicators such as employment and sales eventually also begin to sputter.
The investment opportunity in equities takes place when the leading indicators—those which were the first to signal the slowdown—are going to rise again. One of the most important tenets of the business cycle is that the slowdown will continue until the causes that created the slowdown are brought under control.
The main causes of the slowdown are the rise in the main lagging indicators: inflation and interest rates. The slowdown will continue as consumers reduce spending until their purchasing power is restored again. This happens when inflation and interest rates decline. This is also the time when labor costs decrease, improving business profitability.
As retail sales increase because of rising consumers’ purchasing power, the other coincident indicators also rise in employment, production, and income. These developments will reinforce themselves and the positive loop will continue until the economy overheats. This is the time when the lagging indicators raise their ugly heads, and the business cycle starts all over again.
Where Are We Now
The lagging indicators are rising. Consumer prices keep moving higher; up more than 8%. Interest rates—short and long-term—have reached new highs for this business cycle. The two-year Treasury yield soared from 0.2% to 2.6% in the last 12 months. The stock market, an important leading indicator, shows no gains since June 2021 as of this writing. Auto sales and housing have been weakening after several months of rising inflation and interest rates.
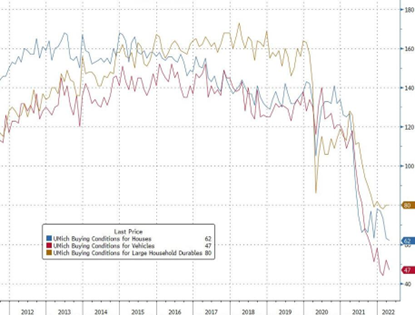
Consumers cut spending on big-ticket items first when income after inflation declines, as is happening now (see graphs of buying conditions from the University of Michigan survey below). In other words, an increase in the lagging indicators (inflation and interest rates) lead to a peak in the leading indicator of consumers’ buying conditions.
The business cycle is just past Point Seven (see first chart above). The next trend will be slower growth in the coincident indicators. Retail sales and income after inflation are already contracting. Production and employment are still strong. They will have to weaken to reflect cuts in production to reduce inventories. Inflation and interest rates will decline following more weakness in the coincident indicators (sales, income, production, and employment). In the meantime, growth in business activity will continue to decline until inflation and interest rates drop enough to increase consumers’ purchasing power. It will be a long and drawn-out process.
Economic Growth Drives Sectors’ Performance
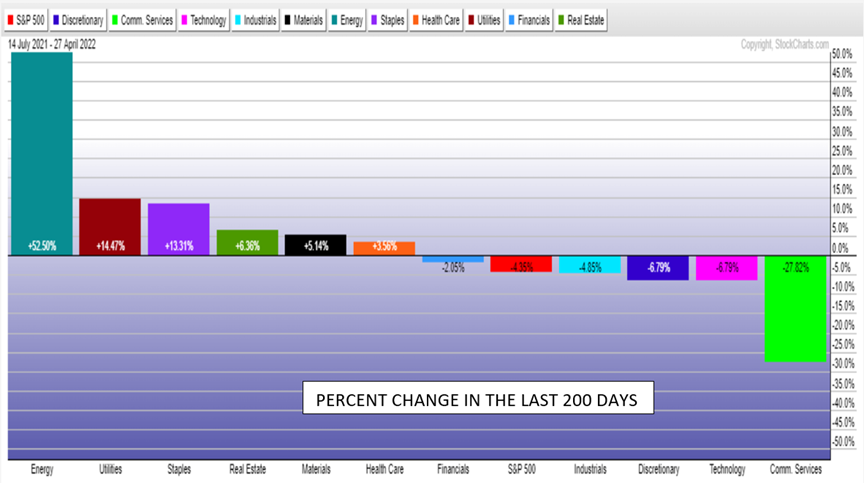
The environment faced by the financial markets is slower economic growth. This is an important trend because the sectors outperforming the market when the business cycle declines, reflecting slower economic growth, are the non-cyclical sectors (XLP, XLU, XLV, XLRE) (see chart below, energy being the exception). The chart shows the percent change over the last 200 days. During a period of stronger growth, cyclical stocks (XLRE, XLI, IYT, XLF, XLE, XLB, XME) outperform the market.
The strong performance of the non-cyclical sectors confirms the stock market is past its phase of fast growth.
High-Beta and Low Volatility Stocks Respond to Economic Forces
High-Beta ETFs (SPHB) and Low-Volatility Stocks ETFs (SPLV) perform in different ways depending on the trend of the business cycle, as shown in the following chart.
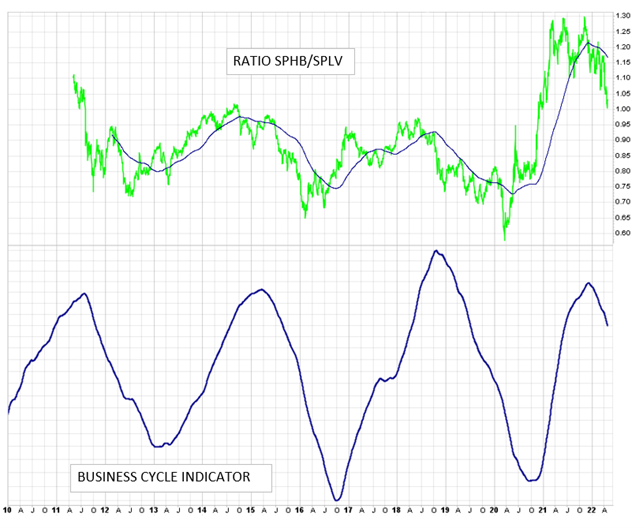
The above chart shows two sets of graphs. The upper panel represents the graph of the ratio SPHB/SPLV. The business cycle indicator computed in real-time from market data and reviewed in each issue of The Peter Dag Portfolio Strategy and Management is in the lower panel.
High-beta stocks (SPHB) outperform low-volatility stocks (SPLV) (the ratio in the upper panel rises) when the business cycle rises, reflecting stronger economic growth due to declining or stable inflation and interest rates.
However, low-volatility stocks (SPLV) outperform high-beta stocks (the ratio in the upper panel declines) when the business declines because of rising inflation and interest rates—as has been happening since late 2021.
Key Takeaways
- The leading indicators will continue to decline, reflecting rising inflation and interest rates.
- During such time low volatility stocks (SPLV) will continue to outperform high-beta stocks (SPHB).
- The leading indicators, such as stock prices, autos, housing, and consumer sentiment of the University of Michigan, will bottom and rise again following a decline in inflation and interest rates.
- The decline in inflation and interest rates will be preceded by declines in the coincident indicators (sales and income after inflation, production, and employment).
- This will be the time when high-beta stocks (SPHB) start outperforming low-volatility stocks (SPLV).


