

In the realm of money and investing, there is one cold hard truth that we’ve all come to learn in 2022, and that is that stocks do not always go higher, explains Jim Woods, editor of Bullseye Stock Trader.
Of course, you knew that already, but it is easy to forget that the last time we saw stocks plunge this much was during March 2020, when the world was essentially on lockdown because of Covid-19. Yet that pandemic pullback didn’t last very long, and since those March 2020 lows, markets have really pushed higher.
The chart here of the major domestic equity averages—the Dow Jones Industrial Average (DJI), S&P 500 Index (SPX), Nasdaq Composite (NDX), and Russell 2000 (RUT)—over the past three years shows a sharp pullback in the first quarter of 2020, and now the pullback so far in 2022.
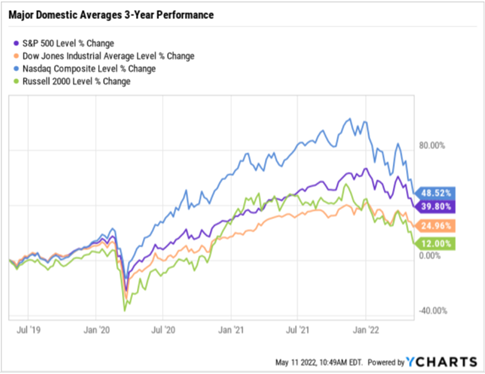
Technically speaking, the Nasdaq Composite and the Russell 2000 officially fell into bear market status this year, and while the Dow and S&P 500 are “merely” in correction territory and not officially in bear status, it sure feels like the world is awash in ursine forces beyond our control.
Yet, what is the cold hard truth about bear markets? How long do they typically last, how much damage do they do, and how do these market cycles really work?
To answer that question, I uncovered some research conducted by Hartford Funds that I think will be quite valuable to review here. I suspect that if you are like me, the data will both surprise and placate your restless mind.
- Stocks lose 36% on average in a bear market. By contrast, stocks gain 114% on average during a bull market.
- Bear markets are normal. There have been 26 bear markets in the S&P 500 Index since 1928. However, there also have been 27 bull markets, and stocks have risen significantly over the long term.
- Bear markets tend to be short-lived. The average length of a bear market is 289 days or about 9.6 months. That’s significantly shorter than the average length of a bull market, which is 991 days or 2.7 years.
- Bear markets have been less frequent since World War II. Between 1928 and 1945, there were 12 bear markets or one about every 1.4 years. Since 1945, there have been 14, one about every 5.4 years.
- Half of the S&P 500 Index’s strongest days in the last 20 years occurred during a bear market. Another 34% of the market’s best days took place in the first two months of a bull market before it was clear a bull market had begun.
- A bear market doesn’t necessarily indicate an economic recession. There have been 26 bear markets since 1929, but only 15 recessions during that time. Bear markets often go hand in hand with a slowing economy, but a declining market doesn’t necessarily mean a recession is looming.
- Bear markets can be painful, but overall, markets are positive the majority of the time. Of the last 92 years of market history, bear markets have comprised only about 20.6 of those years. Stated differently, stocks have been on the rise 78% of the time.
So there you have it, the cold hard truth about bear markets. As you can see, the reality is that while bears are real, destructive forces in the market, they are no reason to panic and no reason to avoid investing in stocks.
The stock market remains the very best wealth-creation engine ever devised, and you need to realize that, even when you see stocks plunging.
Yes, you need to be cautious and reduce the risk in your portfolio when the trend is bearish. But do not let trepidation and ursine phobia paralyze you.


