

In my article of July 29, 2022, the action of the option markets pointed to a bear market in stocks, states George Dagnino, of Peter Dag Strategic Money Management.
The objective of this article is to review also the indicators discussed in previous articles (published on Seeking Alpha) and examine what they are saying now.
Phase one starts when business needs to replenish inventories, realizing their level is too low. The decline in inflation and interest rates that took place in Phase four improved consumers’ purchasing power and their willingness to spend. Production must increase to meet demand.
The increased demand for raw materials and financing to improve capacity places a floor under commodities and interest rates.
Phase two reflects the increased demand caused by increasing employment and income. Businesses must now aggressively replenish inventories. In this phase, the economy overheats. Excessive production places upward pressure on commodities and interest rates, and inflation. Toward the end of Phase two commodities, interest rates, and inflation rise.
Phase three is a critical point of the business cycle because growth begins to sputter. Rising inflation reduces consumers’ purchasing power. The University of Michigan survey reflects increasing consumers’ pessimism about their finance and outlook. Demand slows down. The rise in commodities, interest rates, and labor costs start having a negative impact on profitability. Inventories need to be reduced to reflect slower demand and keep margins under control.
Phase four reflects the effect of lower production. Commodities, interest rates, and inflation are now declining because of the weak demand and the aggressive reduction in production to bring inventory growth in line with demand. This phase will continue until consumers recognize their purchasing power is improving. The University of Michigan survey shows consumers’ optimism rising sharply.
Phase one is now underway again.
The business cycle is currently in Phase three, suggesting we are much closer to a peak than the bottom of the bear market and of the economy.
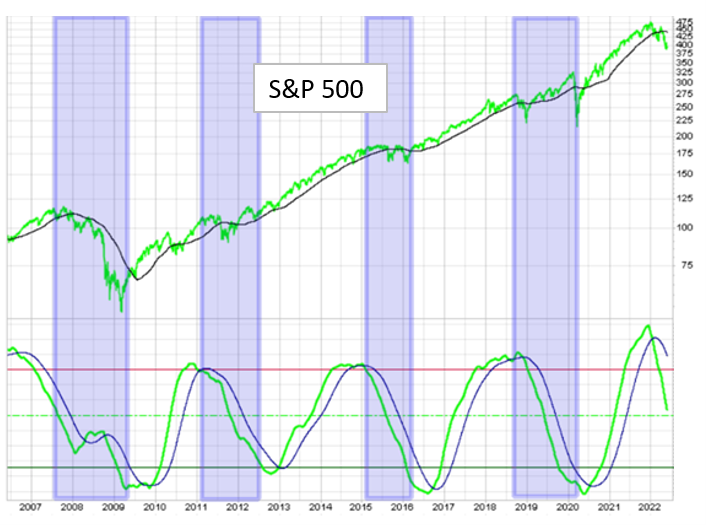
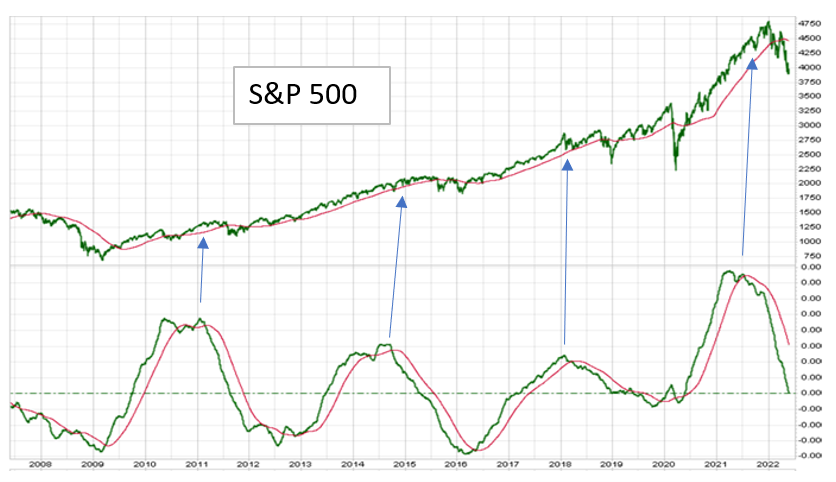
The above chart shows the graphs of the S&P 500 (SPX) in the upper panel and of the business cycle indicator, published in each issue of The Peter Dag Portfolio Strategy and Management, in the lower panel. The business cycle indicator is computed in real-time using market data.
The chart shows how a decline in the business cycle indicator, reflecting slowing economic growth, signals a period of weakening market conditions. A rise in the business cycle indicator, reflecting rising economic growth, points to a strong equity market.
The current decline in the business cycle indicator points to continued weakness in stocks. This weakness is caused by disappointing earnings growth. Excessive inventory accumulation is one of the main reasons for this development—an issue discussed in detail in the past several months on The Peter Dag Portfolio Strategy and Management.
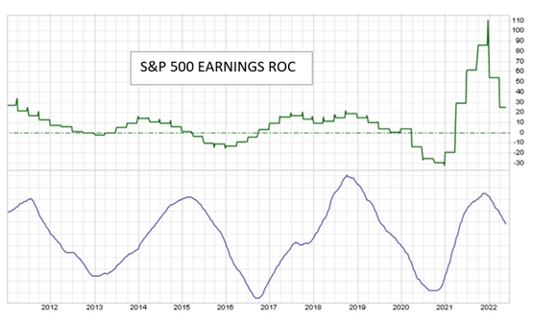
Periods of market appreciation or declines reflect the cyclical behavior of earnings. The above chart shows in the upper panel the growth in earnings of the S&P 500. The lower panel shows the business cycle indicator published by The Peter Dag Portfolio Strategy and Management. The change in earnings follows closely the business cycle. They rise faster when the business cycle indicator rises, reflecting stronger economic conditions. They slow down when the business cycle declines, reflecting weaker economic conditions.
The current trends of the business cycle indicator are down, pointing to slower growth in earnings.
The Strategy Indicator and Stock Sectors
In an article published on 2/29/2021 discussion focused on the behavior of the eleven sectors of the S&P 500 during several business cycles.
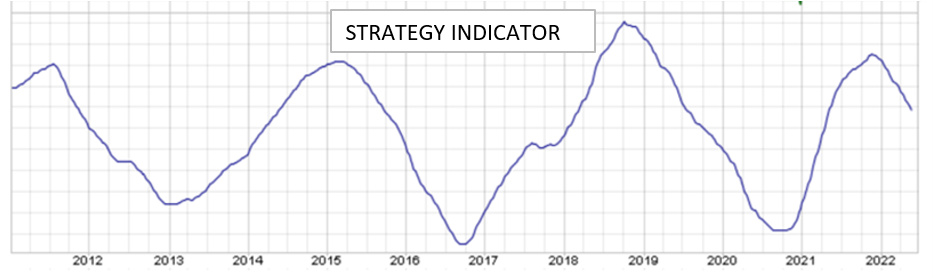
The chart above shows the strategy indicator as published in The Peter Dag Portfolio Strategy and Management. The graph shows the bottom of the business cycle that happened in 2020 and the top in 2022. The odds favor the bear market to bottom not before the end of 2022, possibly in 2023 if the strategy indicator follows the historical four-year cycle.
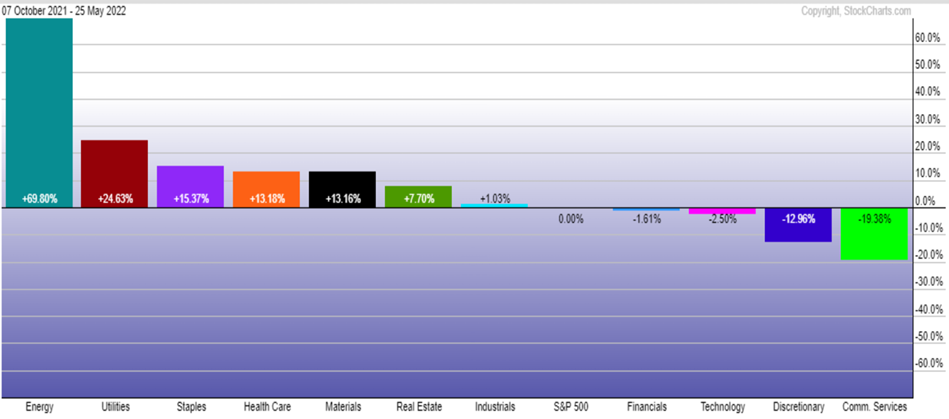
The above chart shows the performance of the sectors relative to the S&P 500 during the decline of the business cycle. Since October 2021, the strongest sectors have been XLU, XLP, XLV, and VNQ—excluding materials and energy. The cyclical sectors underperformed. This is a pattern typically found when the business cycle declines, reflecting a weakening economy.
The action of the sectors confirms the economy is slowing down as reflected by the decline of the business cycle indicators and it suggests the most appropriate strategy is to focus on defensive sectors.
The Option Market and the Bear Market
The above chart is the updated version of the chart shown in the article of July 29, 2021. The upper panel shows the graphs of the S&P 500 (SPY). The lower panel shows the indicators computed using option market data. This gauge is still declining and points to more market weakness.
The system of leading, coincident, and lagging indicators

The above chart helps to recognize the economic and financial conditions taking place at the bottom of the bear market. The above graphs were also discussed in detail, including the implication of a bear market, in my article of October 26, 2021. The graphs show the relationships between leading, coincident, and lagging economic/financial indicators during a business cycle.
For the purpose of this article, the important leading indicators are stock prices, consumer optimism, and commodities. The coincident indicators are income, production, and sales. The lagging indicators are interest rates and inflation.
The above chart is saying an economic slowdown (coincident indicators) is preceded by a slowdown in the leading indicators. A slowdown in the leading indicators is preceded by rising lagging indicators. The leading indicators rise following weakness in the lagging indicators.
This is where we stand now. Inflation and interest rates are rising. The leading indicators, such as equity market and consumer optimism, are responding accordingly with equities and consumer optimism declining.
When will the bottom in the leading indicators (stock prices and consumer optimism) take place? The beginning of a new bull market and rise of the business cycle will happen when interest rates and inflation decline, enough to re-establish consumers’ purchasing power and therefore stimulate demand for goods and services.
Key takeaways
- The business cycle is slowing down, reflecting weakening economic conditions. These conditions have been heightened by rising interest rates and inflation. Excessive inventory accumulation needs to be liquidated because slowing demand will cause further economic damage.
- This is the time when defensive sectors outperform the market.
- Earnings will continue to slow down, and equities will keep heading lower as the economy keeps slowing down. The business cycle is at this stage (Phase three).
- The business cycle will bottom when interest rates, commodities, and inflation show a decline sharp enough to raise consumers’ optimism and increase their purchasing power.
- The new bull market starts as inflation and interest rates decline, and consumer optimism rises again.
- The cyclical sectors begin to outperform the broad market.
- Historical patterns, such as the four-year cycle of the strategy indicator, suggest the bottom of the business cycle and the stock market will take place no sooner than the end of 2022.


