Last week, the market encountered a sudden shift for the good, explains Bryan Perry, editor of Cash Machine.
The ongoing narrative of higher inflation, fears of recession, and Fed rate hikes gave way to a new narrative that embraced lower inflation, less fear of recession, and fewer Fed rate hikes. As a result, equities roared higher Thursday and Friday, setting a new tone for the market going forward amid several signs of significant tops and bottoms.
It is now seen that demand destruction from soaring energy prices and a little luck with farm-friendly weather around the globe that oil, natural gas, and food-related commodity prices peaked earlier this month. Let’s first start with commodities.
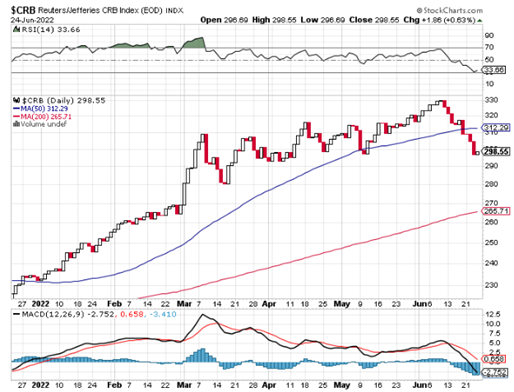
The CRB Index consists of 19 commodities: Aluminum, Cocoa, Coffee, Copper, Corn, Cotton, Crude Oil, Gold, Heating Oil, Lean Hogs, Live Cattle, Natural Gas, Nickel, Orange Juice, RBOB Gasoline, Silver, Soybeans, Sugar, and Wheat. It decisively broke its 50-day moving average uptrend at 312.29, signaling a top and a potential move lower to around 266.0.
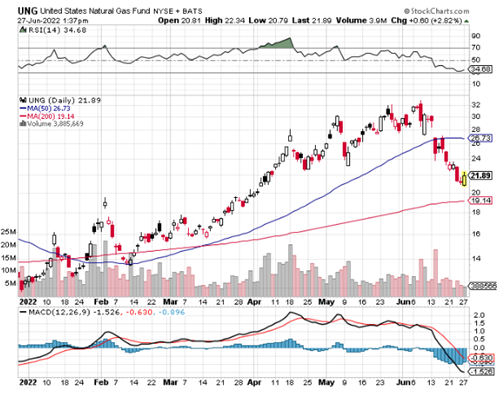
Natural gas prices topped out two weeks ago, on June sixth, at $9.32/MMBtu, breaking a sharp uptrend in light of the “natural gas crisis in Europe,” where Russia slashed natural gas shipments to several European nations by up to 50%.
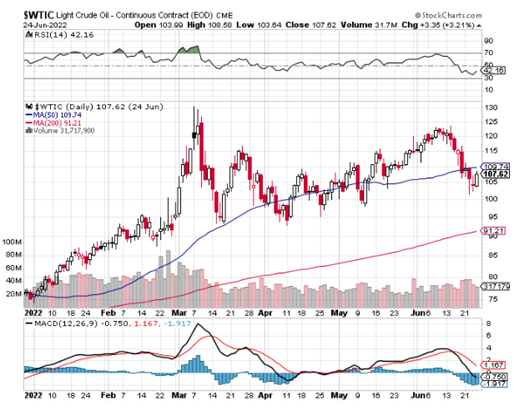
The price of West Texas Intermediate (WTI) crude oil price for August fell back to key 50-day moving average support at around $107/bbl on heavy futures-related selling pressure. It is also being reported that Dubai is brokering Russian oil to India, China, and other non-Western countries that have remained neutral on the war in Ukraine, opting for energy security over taking a public position against Russia.
Now, just because commodities have violated their near-term uptrend lines in no way removes the risk of another spike or set of spikes to come based on a number of external factors. Energy and commodities have led the market all year up till last week and this sharp pullback may prove to be brief. Time will tell.
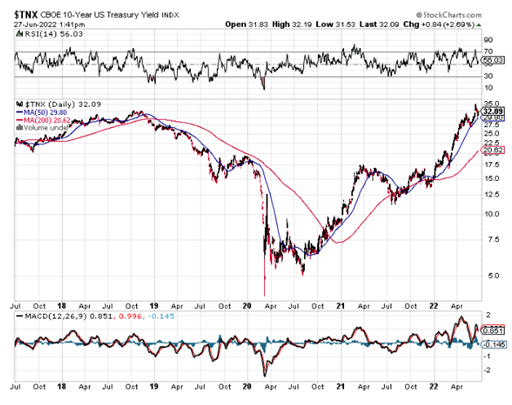
And the one chart that still has the focus of everyone’s attention is that of Treasury yields. While yields have risen from near zero, historically they are still very low when going back to 1980, when the 10-Year Treasury Note (TNX) hit 16%. What we can see from the five-year chart is that the primary downtrend line for yields has been breached, with 4% looking like the next level that will be realized.
Consumer sentiment appears to have hit a bottom regarding the outlook for the economy. The final University of Michigan Index of Consumer Sentiment for June dropped to 50.0 from the preliminary reading of 50.2. The final reading for May was 58.4, representing what could be a worst-case data point.
The June reading compares to 85.5 in the same period a year ago and is the lowest reading ever on record dating back to 1978.
So, let’s get to the part where investors should consider putting some powder to work by taking the long-term chart into view. Looking at last week’s tape, it was by far and away dominated by big-cap software, and for good reason. Software companies are not dependent on commodities, low interest rates, supply chains, vast numbers of hourly-wage workers, ideal weather conditions, and a robust consumer-like 99% of every other business.
Software companies bring cost-saving efficiency gains to businesses that seek to optimize productivity and maintain profit margins when external costs that can’t be controlled need to be better managed. This was evidenced in the pandemic where businesses invested heavily in software upgrades to survive and thrive.
With each and every major economic shock, revenues might not recover to pre-Great Recession or pre-pandemic levels, but earnings will rise to record levels because productivity gains (doing more with less) are hugely attributable to technology-based investments. This is especially true in the industrial sector where waves of layoffs are replaced by robotics and more cutting-edge automation processes. So, let's hold this thought for a minute and look at the broad market.
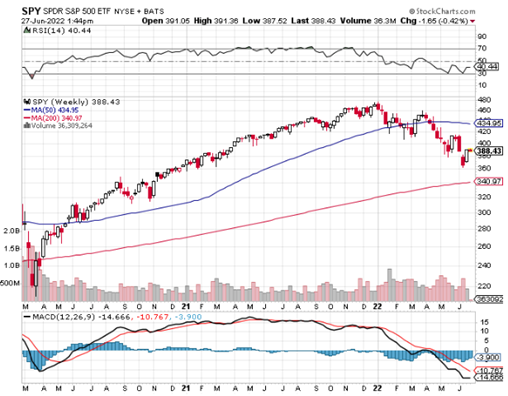
Once again, the economy finds itself on the cusp of recession, with the S&P 500 down 17.93% so far this year, following last week’s sharp gains. Looking at the SPDR S&P 500 ETF (SPY), the long-term uptrend support line comes in at $341, or 3,410, for the S&P index.
Now, let’s do some basic technical analysis 101.
Looking at the one-year chart, it’s a bearish stair-step pattern of lower highs followed by lower lows. And the bottom will not be in until this latest rally undergoes a retest that puts in a higher low that would be above $360 for SPY. I think we get that retest over the course of the next month as the Fed will very likely raise rates by another 75 basis points.
If the retest fails then a move lower to 3,500 for the S&P is likely and would mark a 37% correction from peak to trough that would fall in line with the average market drawdown for the 19 bear markets over the past 150 years.
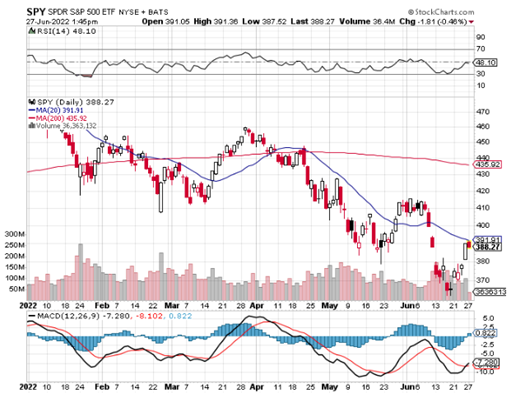
It is easy to see the S&P rally back up to its downward sloping 20-day moving average as the market enters the pre-earnings wait-and-see period of pre-announcements. The market could easily add to its gains this week with any whiff of improving macroeconomic data, but the recession inertia at this point for Europe and Asia is pretty strong and not easily reversed. The data from these two regions will likely deteriorate.
The ray of sunshine in all of this is that the US stock market is closer to a bottom than a top, based on the breach of the uptrend lines for commodities. Wages have probably also peaked for the cycle amid reports of accepted job offerings being rescinded by multiple companies cutting way back on hiring. This is kind of something new and part of the larger “ghosting” phenomenon of the past few years.
While there are forecasts of the S&P falling to 3,000 by some well-followed Wall Street analysts, at this point, the primary long-term uptrend remains a good technical benchmark, meaning there is about 10% further downside risk. If 3,500 for the S&P is violated, then a probable large-scale global liquidity event would unfold.
But we won’t know this until if and when such an event is made known.
What I feel strongly about is that putting a new twist on an old saying is timely. While most are familiar with the saying “sales fixes everything”, I’m of the view that “software fixes margins” when revenues are lagging. The market rewarded this subsector where the highest level of innovation exists, rivaling that of the semiconductor industry, which has its own supply chain issues to surmount.
The market openly revealed to investors last week the sector it favors the most with the fewest number of headwinds going into a protracted slowdown that could last into early 2023. Put it on the watchlist.


