

The British Pound Sterling (GBP) has experienced historical levels of turmoil over the past month and traded at record lows compared to the dollar, states Garrett DeSimone of OptionMetrics.
The freefall in the GBP can be attributed to multiple macroeconomic shocks, including higher energy prices and fiscal plans to increase government debt, stoking inflation.
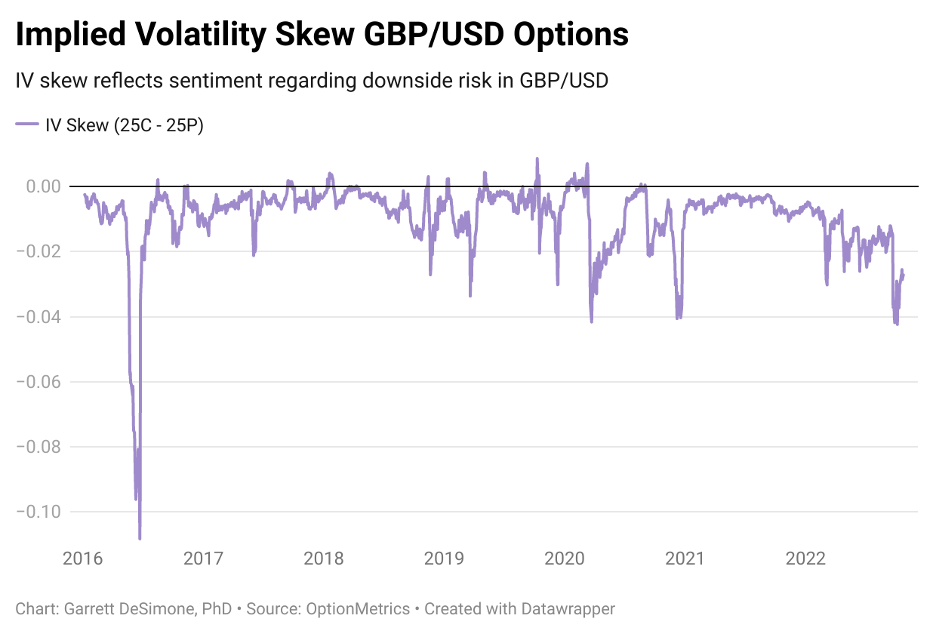
The risks of further depreciation of the GBP are reflected in the volatility of currency options. A measure of downside risk called the implied volatility (IV) skew, reveals investor risk aversion towards depreciation versus appreciation in the UK currency. The skew is calculated as the difference between OTM (out of the money) called IV and OTM put IV. A negative skew indicates investor fears are more heavily weighted towards GBP depreciation.
Graph One plots the historical IV skew from CME-listed GBP/USD futures options. The GBP predominately skews negative, implying investors are primarily hedgers of the downside risk of the GBP versus USD. Negative skew is a symptom of fiscal and political risks that emerge out of the UK. These precipitous drops in GBP may be connected to the Brexit referendum and what many perceive as Liz Truss’ unfunded tax cut proposal. The GBP skew, pictured below, appears to embed fear and perception of broad macro crash risk in the UK.
This fear indicator should contain meaningful cross-asset signals. If currency investors are highly anxious regarding deprecation due to fiscal policy, it will have a knock-on effect on equities. We seek to analyze the return patterns on broad UK equities when the GBP skew is at extreme levels.
Utilizing IvyDB Futures data, we examine the historical 30-day IV skew on CME-listed GBP/USD options from Jan 2012 to the present. Next, monthly holding returns are calculated on the FTSE 100 Index (of companies with the highest market capitalization on the London Stock Exchange). We find that the current skew level of CME-listed GBP/USD options from Jan 2012 to the present sits at -2.1%, which is in the bottom 10% of all values.
Chart Two displays the historical next month returns conditioned on GBP skew being in the range of extreme pessimism or the bottom decile of values.
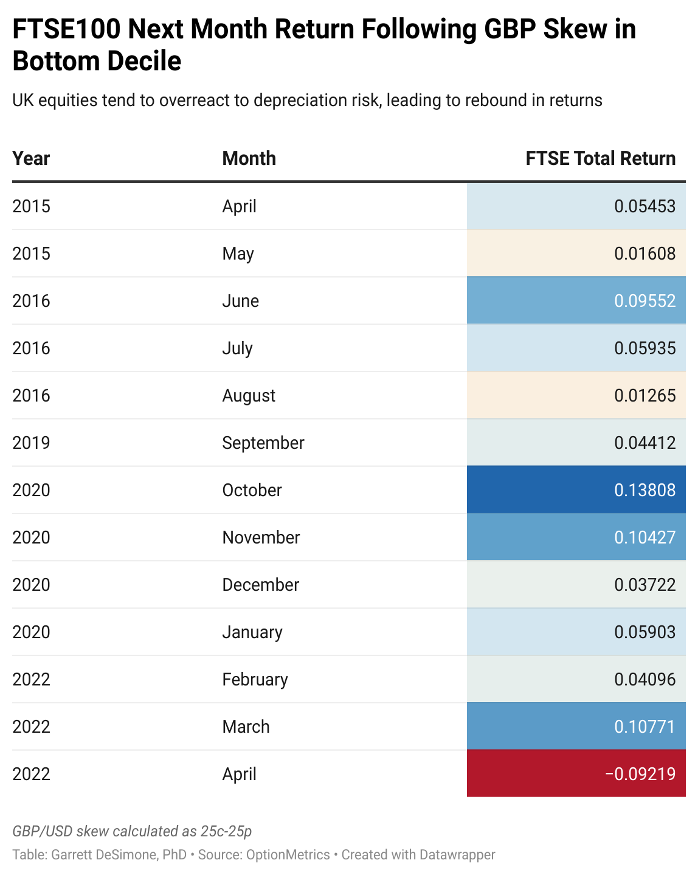
Our results indicate that when the GBP options signal extreme depreciation fear, the FTSE Index delivers incredible outperformance, with an average monthly return of 5.2%. These results are highly right-skewed, showing a successful hit rate of 12 out of 13 months over a 20-year period (only in April 2022 were FTSE total returns negative). This finding indicates that GBP skew is a strong contrarian indicator for broad UK equities, which can be explained by an overreaction hypothesis.
The theory behind overreaction is that investors exaggerate the risk to markets posed by fiscal or government policy, which is translated to currency option prices. Once that risk is resolved (such as, potentially, with Liz Truss’ resignation and failure to enact tax cuts) equity markets inevitably rebound. The GBP’s current skew level represents a positive medium-term outlook for equities moving forward.
Garrett DeSimone, Ph.D., is Head of Quantitative Research at OptionMetrics, LLC. His company is an options database and analytics provider for institutional and retail investors and academic researchers that has covered every US strike and expiration option on over 10,000 underlying stocks and indices since 1996.


