

Lack of follow-through last week, eight of eleven S&P SPDR sectors lower, notes Bonnie Gortler of bonniegortler.com.
Energy (XLE) and Materials (XLB) were the best sectors, while Technology (XLK) and Communications Services (XLC) were the weakest. The SPDR S&P 500 ETF Trust (SPY) fell -3.26%.
S&P SPDR Sector ETFs Performance Summary
10/28/22 – 11/04/22
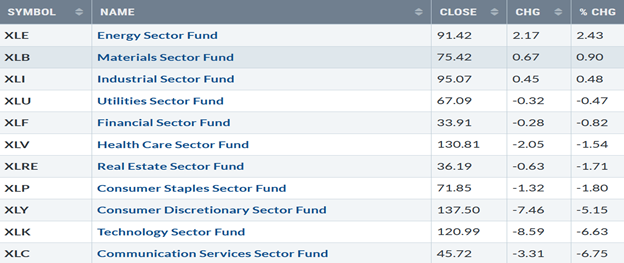
Source: Stockcharts.com
Figure 2: Bonnie's Mix of ETFs
Performance Summary 10/28/22 – 11/04/22
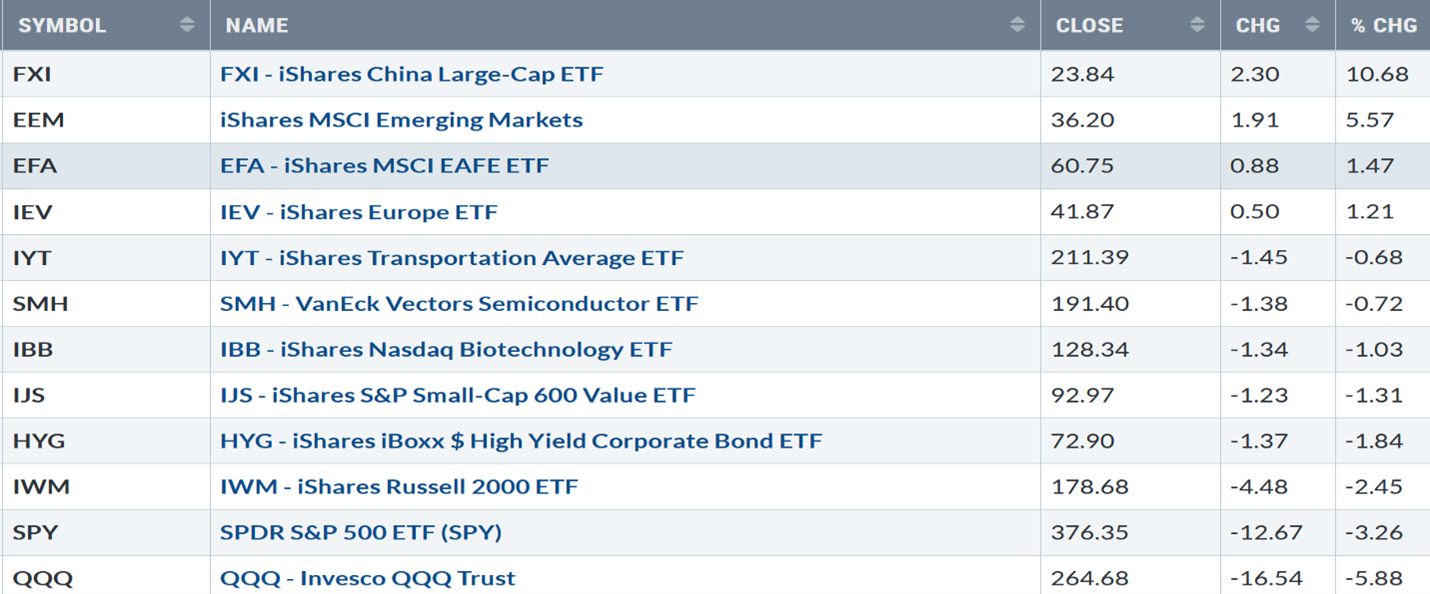
Source: Stockcharts.com
As the dollar weakened, international markets reversed to the upside, with China and Emerging Markets leading. Small Cap Value and Growth continued to outperform the S&P 500. An encouraging sign is that Semiconductors have stopped falling sharply and are beginning to act better and gaining relative strength against the Nasdaq.
Figure 3: VanEck Vectors Semiconductor (SMH) Daily
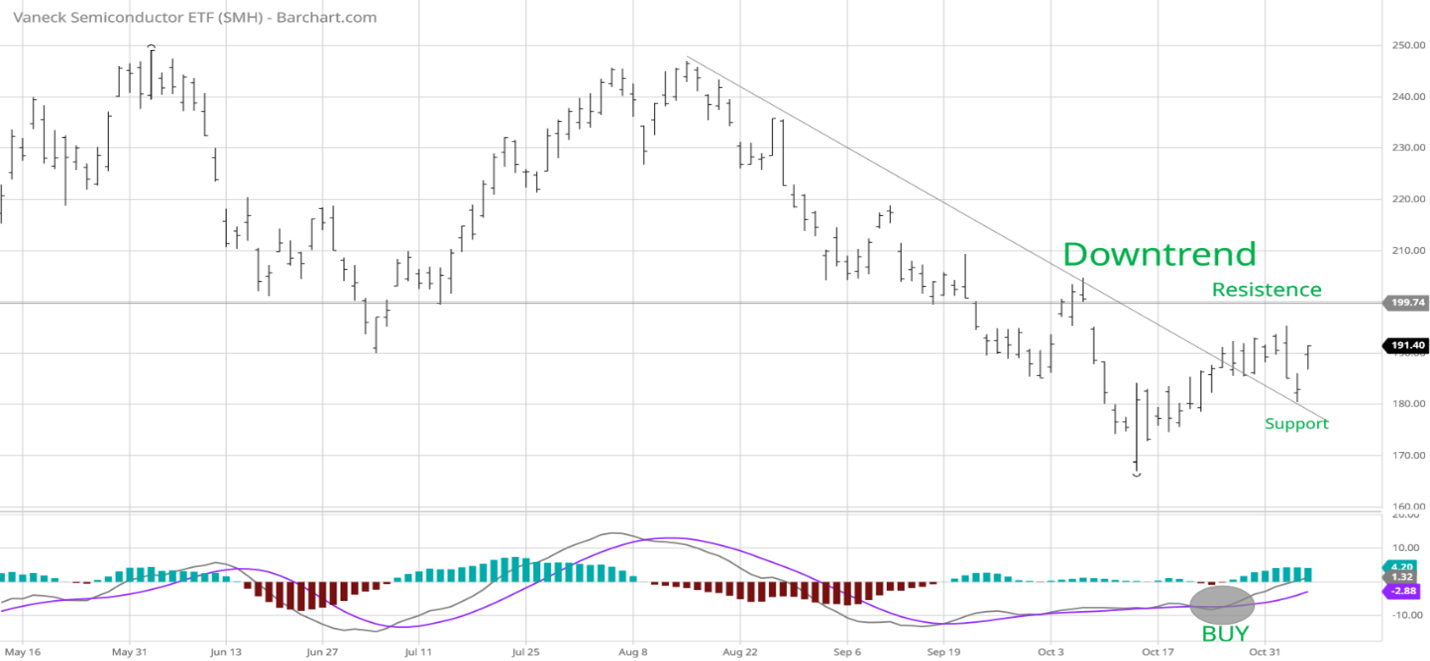
Source: Barchart.com
The top part chart shows the Van Eck Vectors Semiconductor (SMH) concentrated, mostly US-based ETF of mega-cap semiconductors companies. The top holdings in SMH are:
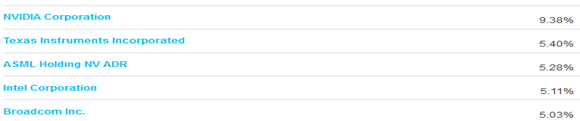
Source ETF.com as of 11/3/22
Semiconductors tend to be a lead indicator where investors are willing to take on increased risk. SMH, in 2022, has been a weak sector of the market, down -38.02%. The SMH broke its downtrend from August and then turned down. However, SMH held above its October low and 180.00 support on last week's pullback before turning sharply higher on Friday,11/4, up +4.65%, closing at 191.40, leading the broad market higher.
The bottom half of the chart is MACD (12, 26, nine), a measure of momentum. MACD remains on its October buy, gaining strength after moving sideways since September. Watch for a close above 196.00, the 50-day moving average, a possible catalyst for further strength in Semiconductor and Technology stocks.
Figure 4: VanEck Vectors Semiconductor/Invesco QQQ Trust (SMH/QQQ) Weekly Relative Strength index Ratio 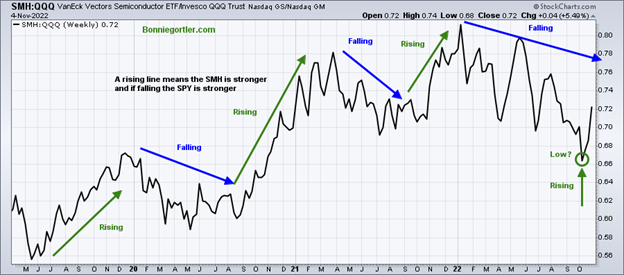
Source: Stockcharts.com
The top part of the chart is the weekly VanEck Vectors Semiconductor/Invesco QQQ Trust (SMH/QQQ) Index Ratio. A rising line means the SMH is stronger, and if falling, the INVESCO QQQ Trust (QQQ) is stronger. The SMH/QQQ ratio hit its lowest level since November 2021 and turned up (green circle), leading me to believe the SMH will likely rise over the next several weeks to months as long as SMH remains above the October low.
Figure 5: UST 10YR Bond Yields Daily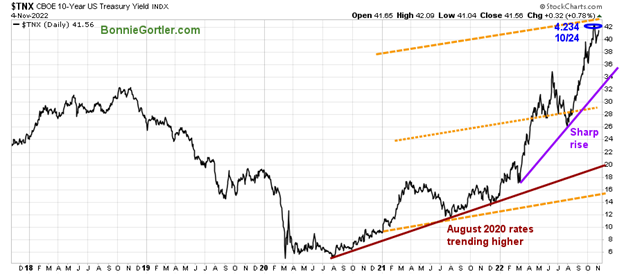
Source: Stockcharts.com
The Ten-Year US Treasury yields rose, closing at 4.156 % last week, remaining below the high made on 10/24 of 4.234% and below the upper channel objective. It would be positive for stocks if yields started to consolidate and the pace of rise slowed. On the other hand, yields rising above the channel would not be favorable. The major averages were lower last week. The Dow fell -1.40%, breaking its four-week winning streak. The S&P 500 fell -3.36%, and the Nasdaq was down -5.65%. Nasdaq continued to underperform both the Dow and S&P 500.
The Russell 2000 Index dropped -2.55%, and the Value Line Arithmetic Index (a mix of approximately 1700 stocks fell -1.95%. Weekly market breadth was negative on the New York Stock Exchange Index (NYSE) and Nasdaq. The NYSE had 1605 advances and 1832 declines, with 225 new highs and 465 new lows. There were 2240 advances and 3060 declines on the Nasdaq, with 368 new highs and 772 new lows.
Figure 6: CBOE Volatility Index VIX
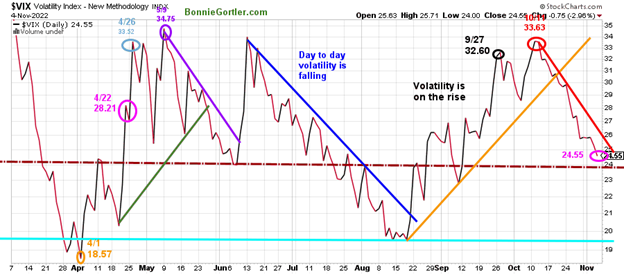
Source: Stockcharts.com
The CBOE Volatility Index (VIX), a measure of fear, has been trading above 20.00 for most of 2022. In late January, VIX made a high at 36.95 on 3/7 (blue circle), followed by a pullback to a low on 4/1 at 18.57 (orange circle). VIX approached the low in August but trended higher, peaking at 33.63 on 10/11 (red circle).
VIX continued to go lower following breaking the August up trend (orange line) in October. VIX fell last week, despite the major averages falling, closing at 24.55 (pink circle), near support at 24.00 (brown dotted line), and a previous resistance area. A close below 24.00 would be positive and imply intraday volatility could slow. On the other hand, a close above 28.00 would indicate an increase in day-to-day volatility and lower prices ahead.
Figure 7: Daily New York Stock Exchange (NYSE) New Lows
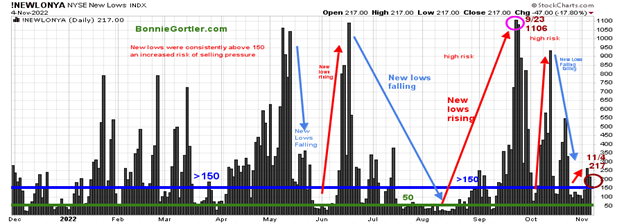
Source: Stockcharts.com
Watching new lows on the New York Stock Exchange is a simple technical tool that helps awareness of the immediate trend's direction. New lows warned of a potential sharp pullback, high volatility, and "panic selling" for most of 2022, closing above 150 in 2022. The peak reading was 9/23 when new lows made a new high of 1106 (pink circle).
New lows fell in late October below 150, out of the high-risk zone. However, with last week's decline, new lows are rising again, closing at 217 (brown circle) above 150, the high-risk area. It will be favorable if new lows contracts below 150 and then falls between 25 and 50. Learn more about the significance of new lows in my book, Journey to Wealth, published on Amazon.
Figure 8: Daily iShares Russell 2000 (IWM) Price (Top) and 12-26-9 MACD (Bottom)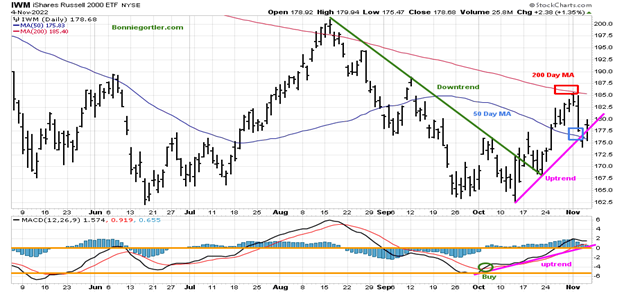
Source: Stockcharts.com
The top portion of the chart is the daily iShares Russell 2000 Index ETF (IWM), the benchmark for small-cap stocks, with a 50-Day Moving Average (MA) (blue line) and 200-Day Moving Average (MA) that traders watch and use to define trends. At the end of March, IWM failed to break out above resistance at 210.00 and turned lower with unsustainable rallies. Last week IWM fell -2.45%, closing at 178.68, falling below its 50-Day Moving Average (blue rectangle) on Thursday and breaking the October uptrend. However, IWM on Friday, a volatile day, closed near the top of its range and above the 50-day MA, a sign of underlying strength.
Short-term resistance remains at 185.00 and 200.00. Support is at 175.00 and 170.00. MACD (middle chart) remains on its buy and in an uptrend. A close above 185.00 would be favorable; however, a close below 175.00 would be negative in the short term. If you are interested in following this chart and other charts during the week, I invite you to join my FB group Wealth Through Market Charts, where I post updated charts intraday throughout the week.
The Intermediate Trend Remains Positive for Small Caps.
Figure 9: Weekly iShares Russell 2000 (IWM) Price (Top) and 12-26-9 MACD (Bottom)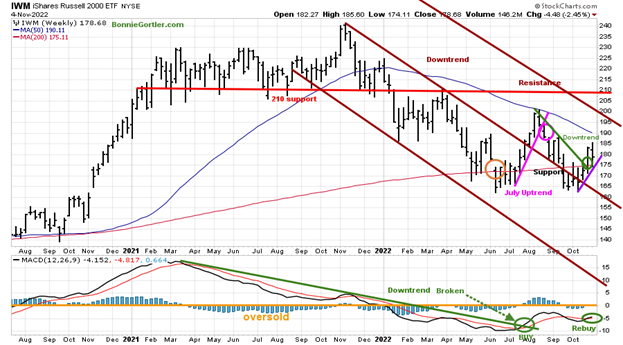
Source: Stockcharts.com
The Russell 2000 (IWM) stalled below the 50-Week Moving Average in August and then turned down, breaking the July uptrend. In October, IWM reversed, breaking the downtrend (green line), and began to gain relative strength compared to the S&P 500.
Last week IWM successfully tested support at 175.00 and turned up, closing near the middle of the range for the week above the 200-Week MA but remaining below its 50-Week MA. MACD (bottom chart) remains on a buy (green circle) and has given a rebuy within a positive double bottom formation. No sale can occur until MACD first exceeds 0 or there is a lower low in MACD. Resistance is 185.00, 191.00, 200.00, and 210.00. Support is at 175.00,170.00 and 162.00. A close below 162.00 implies a decline toward 140.00 and potentally120.00. If IWM remains above 175.00, continue to give the benefit of the doubt to the bulls.
Small and Mid-Cap leadership Is Bullish
Figure 10: iShares Russell 2000 ETF/SPDR S&P 500 IWM/SPY Relative Strength Index Ratio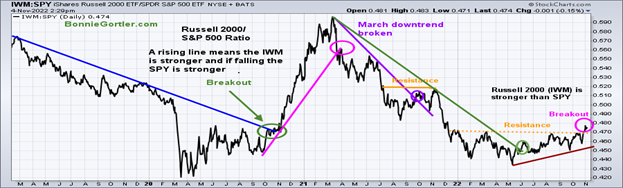
Source: Stockcharts.com
The top part of the chart is the weekly iShares Russell 2000 ETF/SPDR S&P 500 (IWM/SPY) Relative Strength Index Ratio. A rising line means the SMH is stronger, and if falling, the QQQ is stronger. The (IWM/SPY) ratio broke out to its highest level since December 2021, breaking above resistance (pink circle), implying the IWM will likely rise over the next several weeks to months.
Figure 11: SPDR Midcap 400/SPDR/SPDR S&P 500 (MDY/SPY) Weekly 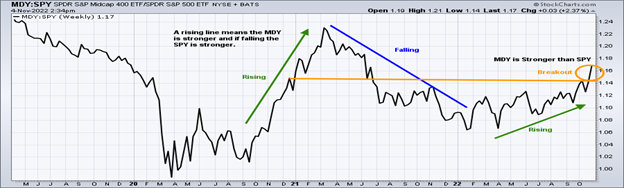
Source: Stockcharts.com
The top part of the chart is SPDR Midcap 400 ETF / SPDR S&P 500 (MDY/SPY) Relative Strength Index Ratio. A rising line means the MDY is stronger, and if falling, the SPY is stronger. The (MDY/SPY) ratio broke out to its highest level since December 2021, breaking above resistance (orange circle), implying the MDY will likely rise over the next several weeks to months.
Figure 12: Daily Invesco QQQ Trust (QQQ) Price (Top) and 12-26-9 MACD (Bottom)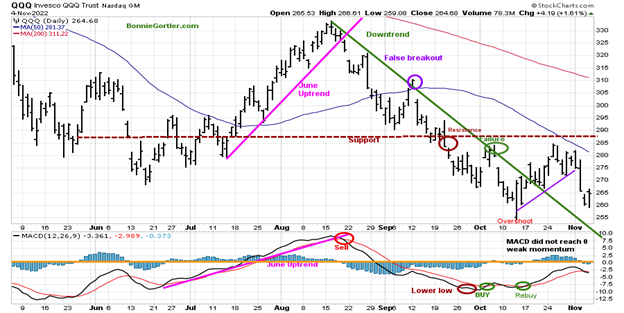
Source: Stockcharts.com
The chart shows the daily Invesco QQQ, an exchange-traded fund based on the Nasdaq 100 Index. The two top holdings in QQQ are Apple (AAPL) and Microsoft (MSFT), with over 20.00% under pressure, which fell -11%, and MSFT -6.14%, not helping the QQQ. QQQ moved lower after a false break out (purple circle) in September of the August downtrend (green line). QQQ continues to lag the Dow and S&P 500 in November as interest rates increase.
QQQ broke its October uptrend (purple line) last week. QQQ was weak, down -5.88%, closing near Friday’s high at 264.68, slightly below support at 265.00. Support is 254.00 and 250.00. Resistance is at 275.00, 286.00, 290.00, and 300.00. The bottom chart is MACD (12, 26, nine), a measure of momentum that remains on a buy, falling and below zero, not yet showing underlying strength.
The trend remains down. However, it’s encouraging that QQQ recovered to finish higher, in the upper range on Friday. However, there is no confirmation of upside momentum. More base building in QQQ is needed, starting with confirming the intermediate trend (weekly chart) by breaking its downtrend.
Figure 13: Weekly Invesco QQQ Trust (QQQ) Price (Top) and 12-26-9 MACD (Bottom)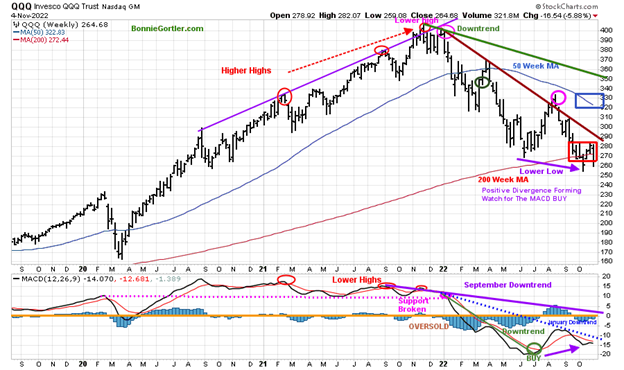
Source: Stockcharts.com
The top chart shows the weekly Invesco QQQ Trust (QQQ) making higher highs peaking in November 2021 (red circles) but failing to make a new high in December 2021. QQQ then formed two downtrends (brown line and green line). One downtrend (brown line) was broken in August, but QQQ immediately turned down (pink circle), stalling below a down-sloping 50-Week MA. QQQ then made a lower low in October (purple arrow). MACD in the lower chart has a higher low. Notice the positive divergence. A rebuy with a break of the January downtrend (blue dotted line) as confirmation would imply the downside momentum has subsided and the start of a potential sustainable rally for the intermediate term (weeks to months).
Figure 14: The S&P 500 Index ($SPX) Daily and 12-26-9 MACD (Bottom)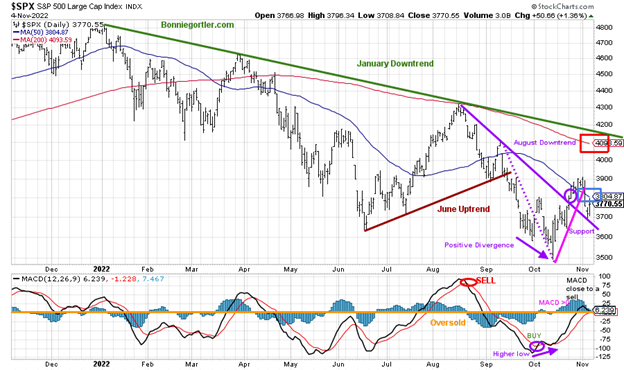
Source: Stockcharts.com
The S&P 500 (SPX) fell -3.35%, closing at 3770.55, bouncing off from support at 3700.00. The 2022 downtrend remains in effect (green line); SPX closed below its 50-Day Moving Average (blue rectangle) and the 200-Day Moving Average (red rectangle). Support is at 3700.00. Resistance is at 3800.00, 3900.00, and 4100.00 MACD, lower chart, is on a buy but close to a sell should the SPX weaken. The risk of a further correction is possible until the S&P 500 has enough strength to close above 3900.00. Keep in mind Technology stocks have a high weighting of over 25% of the S&P 500, without technology stocks strengthening, S&P 500 will likely struggle. In addition, the intermediate trend, like QQQ, remains down.
A peak in the US Dollar?—Bullish for global and US Equities
Figure 15: US Dollar Daily
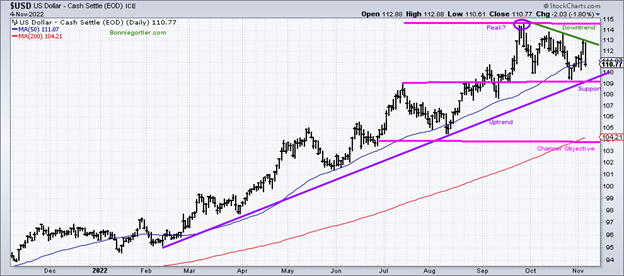
Source: Stockcharts.com
The US dollar appears to have peaked in September, starting a downtrend that remains in effect. On Friday, the US dollar fell sharply, closing near its lows. As a result, the international markets rose sharply, and the US closed well. The continued weakness of the US dollar falling below support and breaking its uptrend (purple line) bodes well for global and US equities in the coming weeks.
Summing Up:
The major averages moved lower, led by Nasdaq last week, with no follow-through early in the week as investors turned cautious and sold stocks. The Fed raised interest rates and made no clear statement of a pause at the November meeting. However, the dollar weakened on Friday, and international, and US markets reversed to the upside, closing near their highs. The most favorable historical seasonal period of the year is now. It’s encouraging that Small and Mid-Cap stocks are now leading in relative strength compared to the S&P 500. Semiconductors have stopped falling sharply and are beginning to act better, gaining relative strength against the Nasdaq. Keep an eye on market breadth on the NYSE and Nasdaq. With an expansion of new highs and a contraction of new lows, the odds favor equities to work their way higher over the next several weeks.
Remember to manage your risk, and your wealth will grow.
I would love to hear from you. If you have any questions or comments or would like to talk about the market, email me at Bonnie@Bonniegortler.com.
Disclaimer: Although the information is made with a sincere effort for accuracy, it is not guaranteed that the information provided is a statement of fact. Nor can we guarantee the results of following any of the recommendations made herein. Readers are encouraged to meet with their advisors to consider the suitability of investments for their own particular situations and for determination of their own risk levels. Past performance does not guarantee any future results.


