

Since commodities are essential industrial inputs, they are sometimes used as an indicator to gauge future economic conditions, states Brett Friedman of Winhall Risk Analytics.
Although not as widely reported as developments in the equity and fixed-income markets, recent price action in certain commodity markets may be indicating slower worldwide industrial demand and the prospect of an imminent recession. Let’s illustrate with a few representative examples and charts.
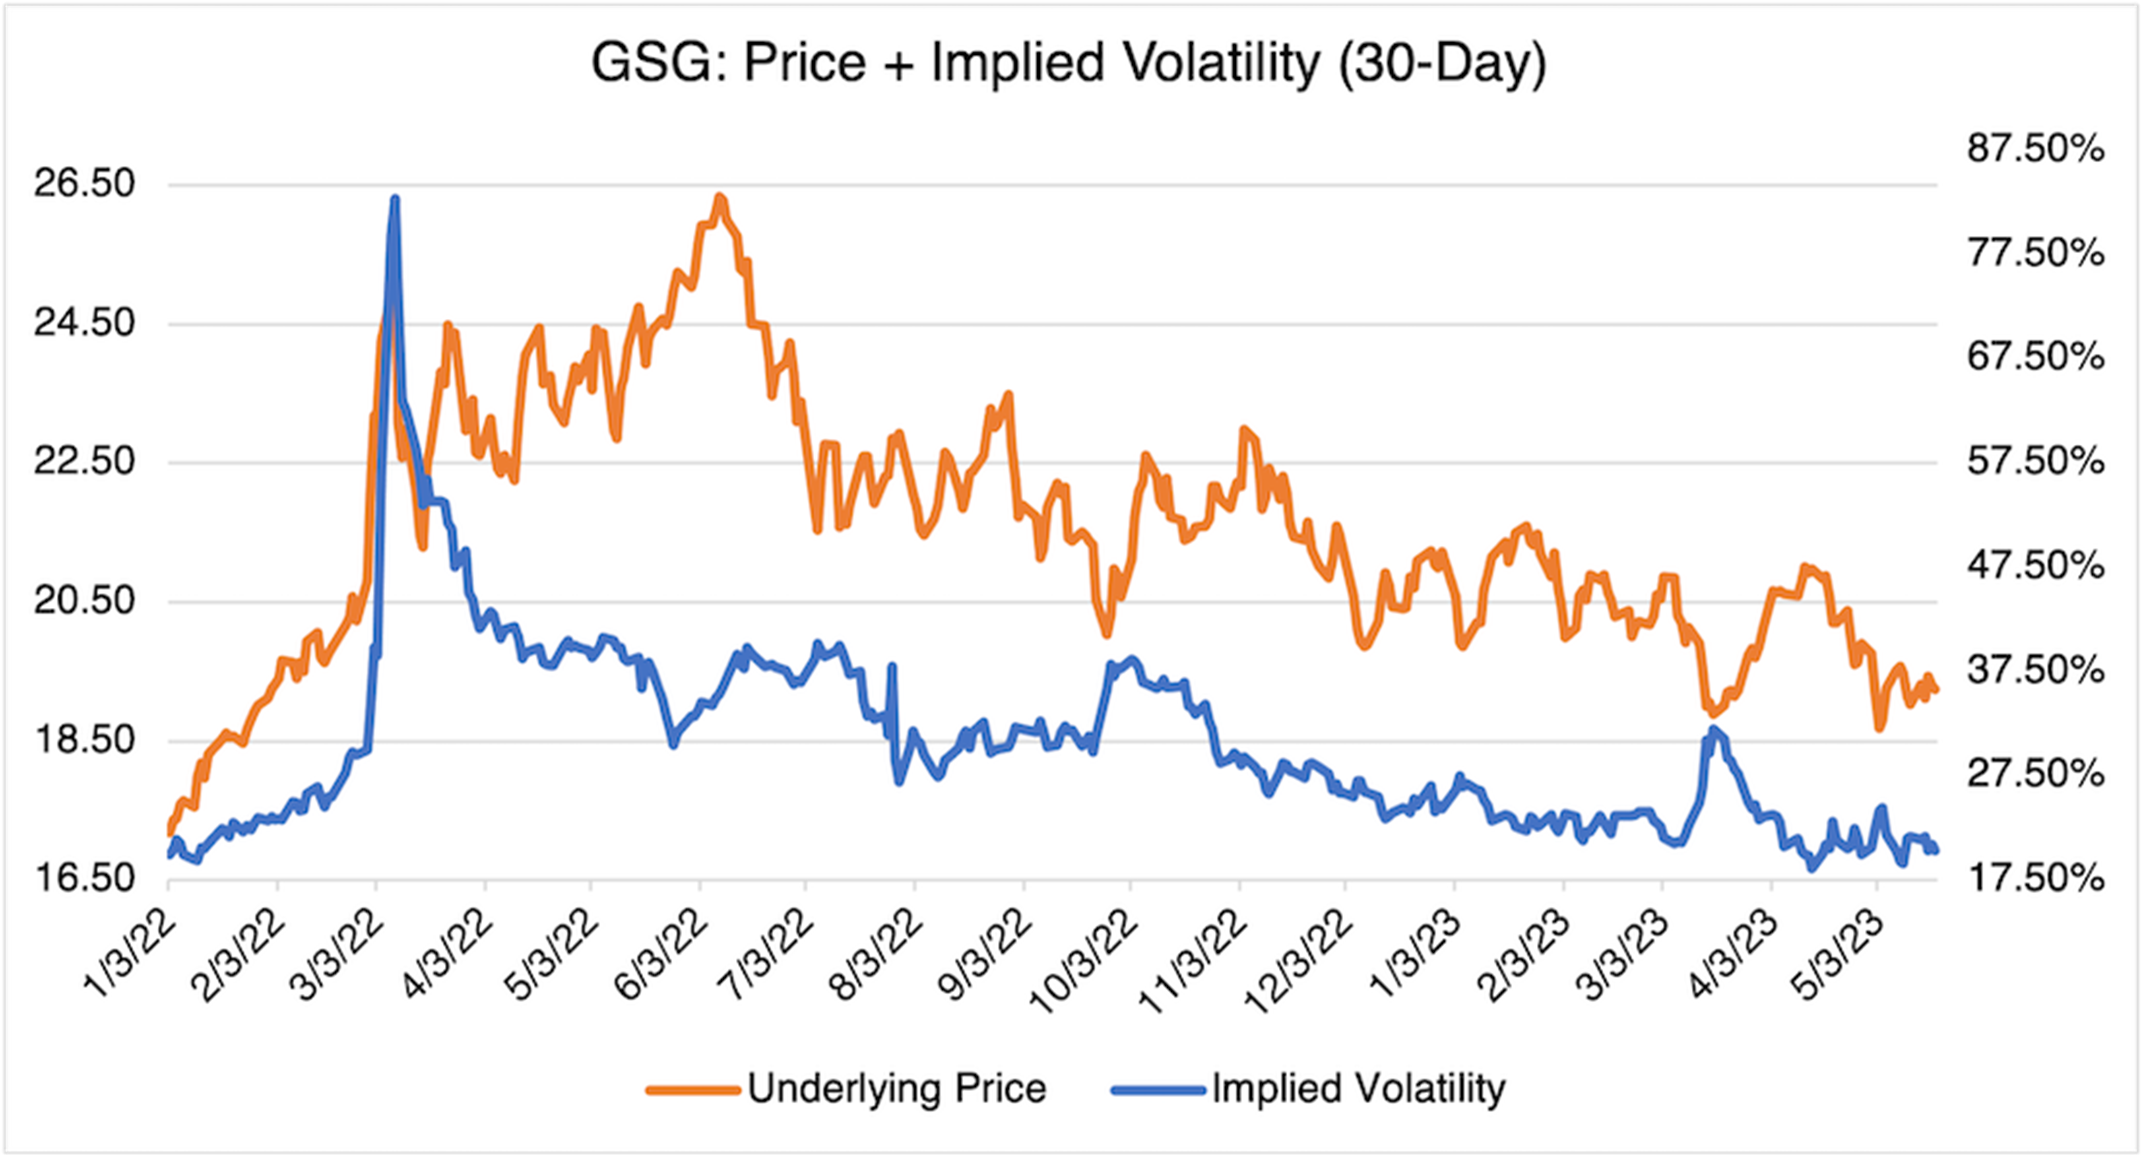
First, let’s take a look at the Goldman Sachs Commodity Index (GSCI), the most popular broad commodity index, as tracked by the iShares S&P GSCI Commodity-Indexed Trust ETF (GSG). Since it peaked on 06/09/22 as a result of the initial shock from the war in Ukraine, the index has fallen 26.9%. In addition, its implied volatility has declined from 35.3% to 20.4%, as the effects of the war and associated uncertainty have faded.
Source: OptionMetrics
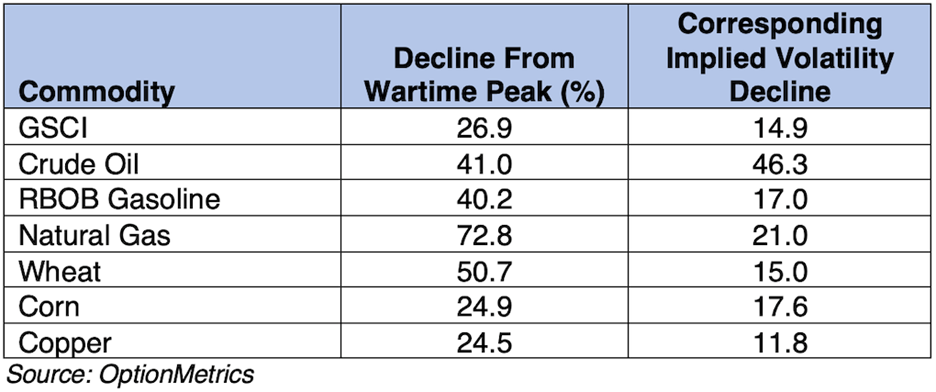
The GSCI's decline since its wartime peak, in terms of both price and implied volatility, is even more dramatic when broken down into its components:
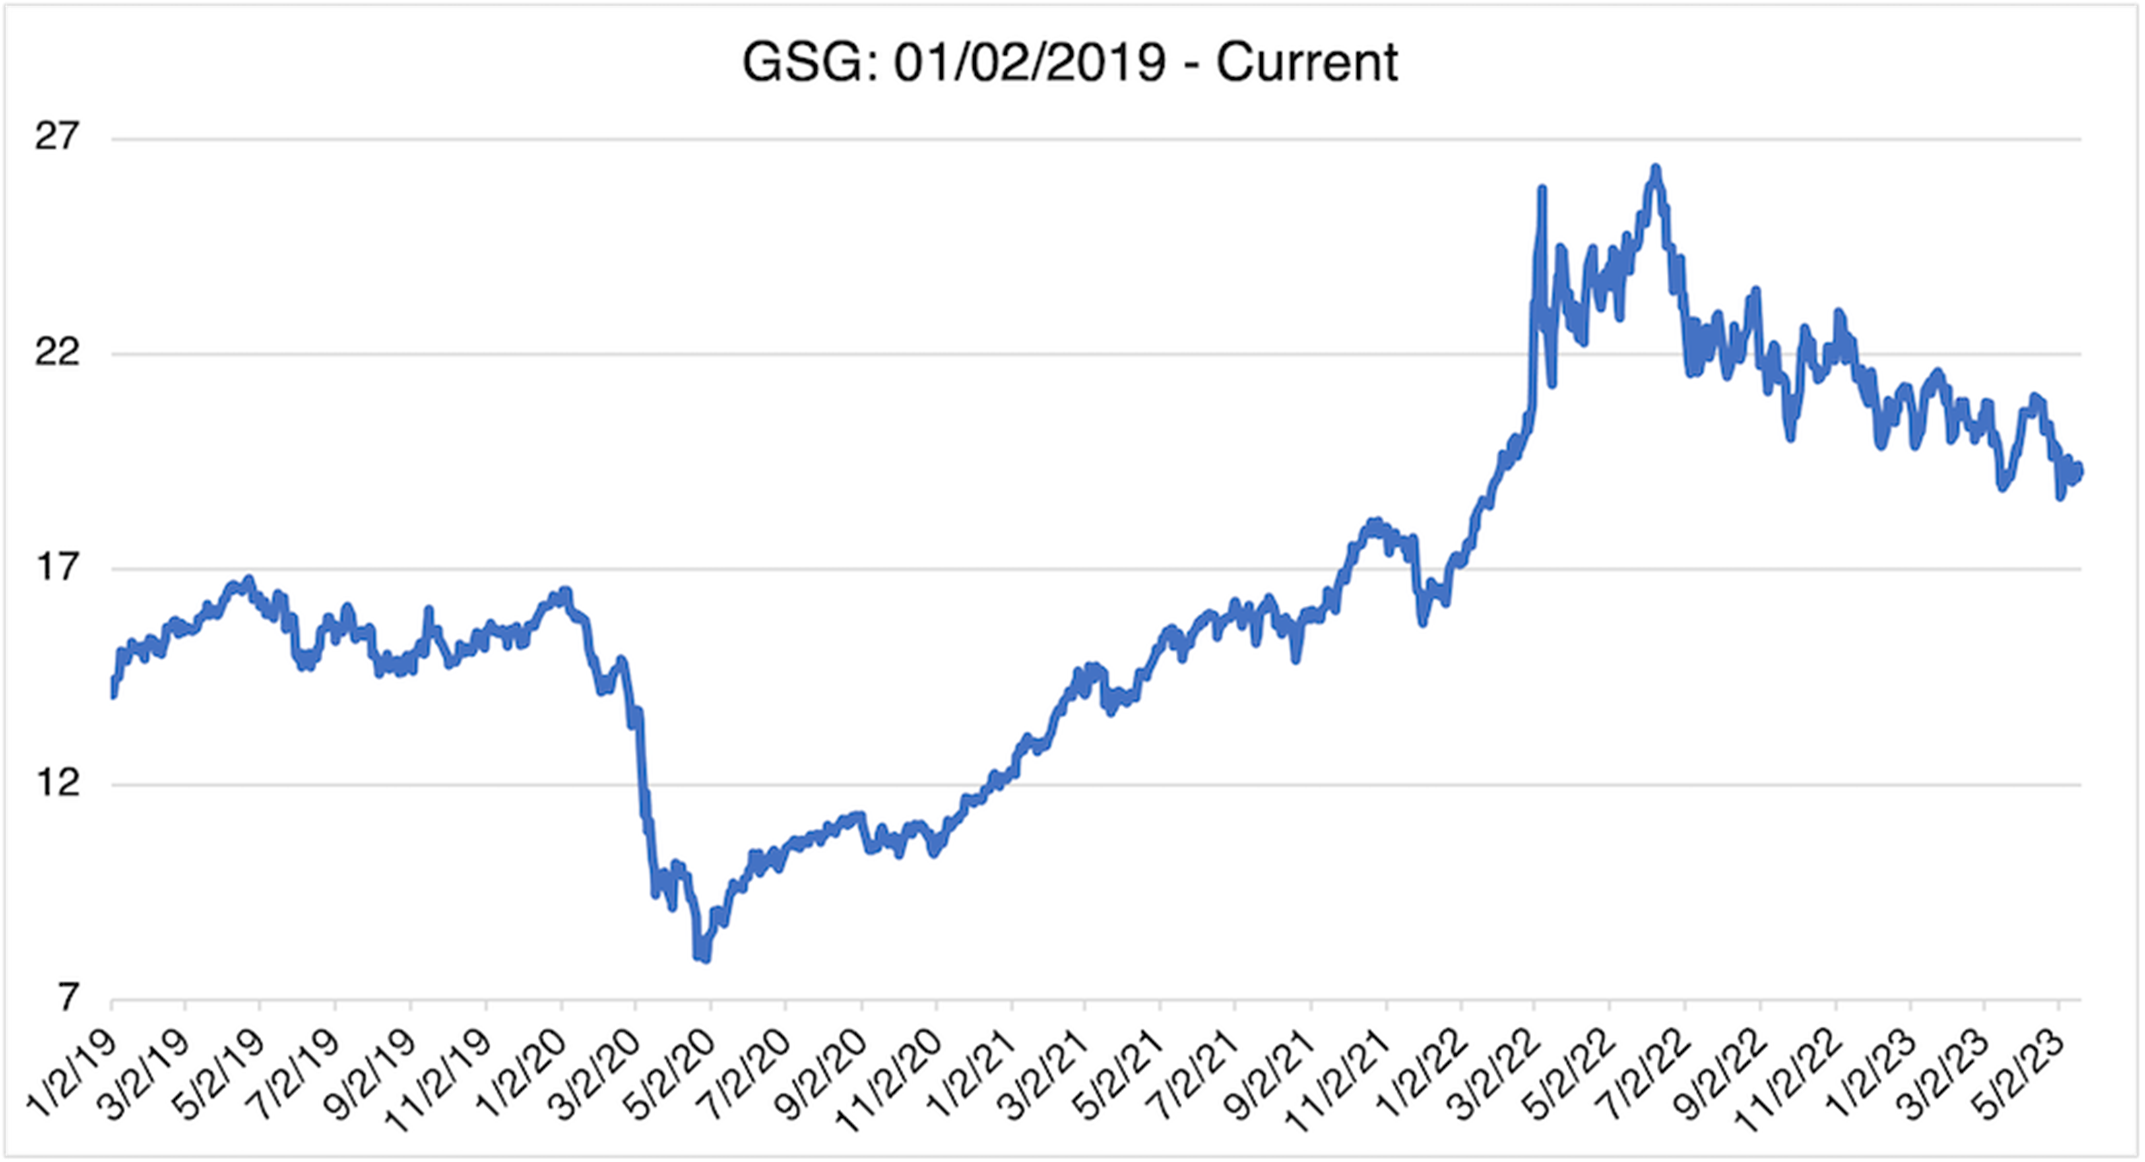
A longer-term view indicates that the index (as tracked by the GSG ETF) may still have a lot more to go to the downside—current levels at approximately 19 are almost 2.5 times higher than the 7.9 all-time low from April 2020 (see below).
Source: OptionMetrics
Notably, the Bloomberg Commodity Index (BCOM), another popular index, dropped below 100 in late May, according to MarketWatch, triggering systemic selling and additional downward pressure.
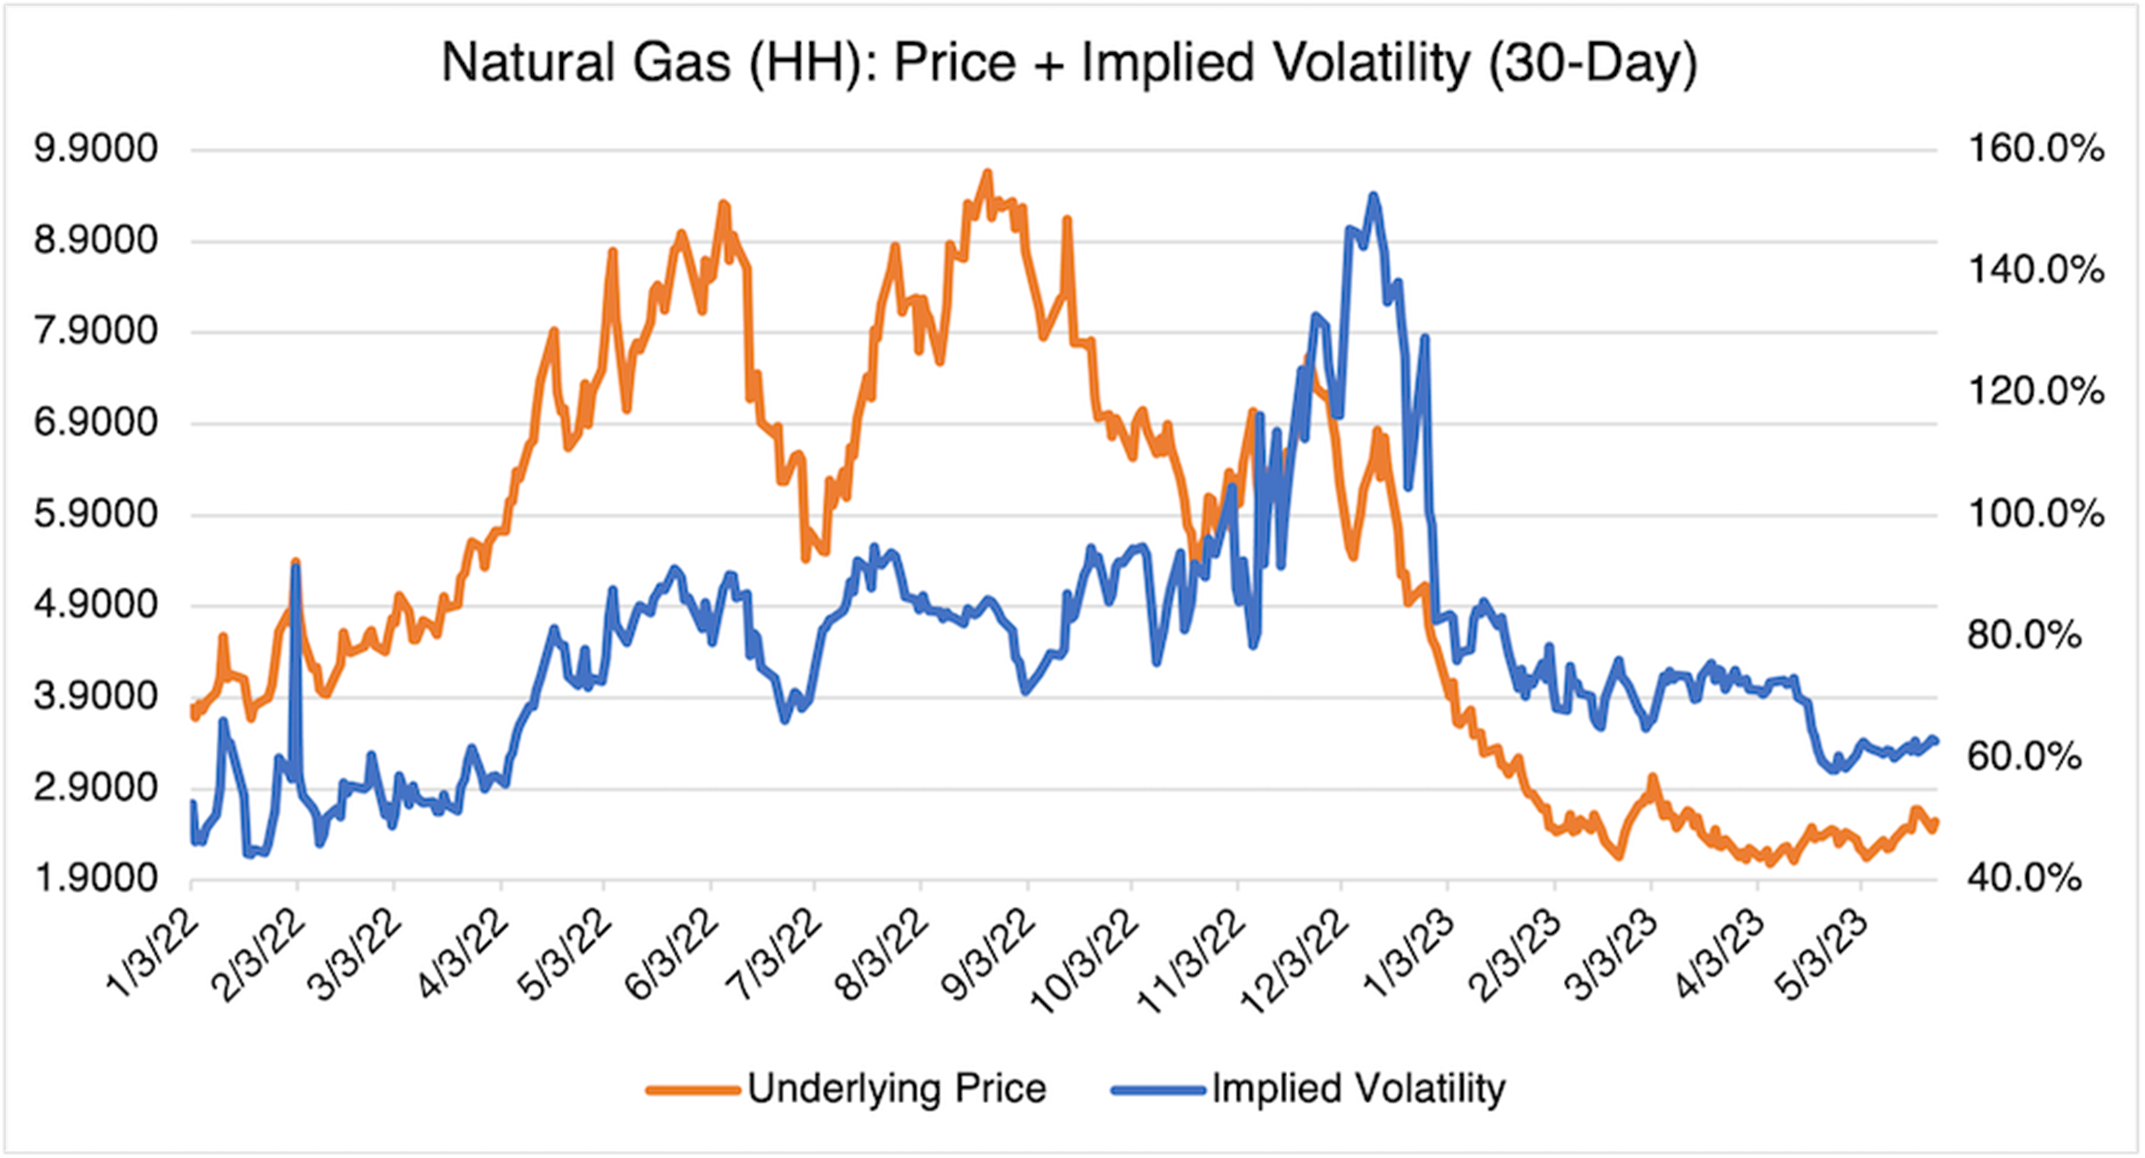
Energy accounts for 61.5% of the GSCI index and is responsible for the majority of the index’s decline. This development is particularly surprising given the severity of the European energy crisis just last fall. Of note is the sharp decline in natural gas prices, almost 73% from its wartime peak and now below pre-war levels. Interestingly, its implied volatility did not peak at the beginning of the war but during last Fall when natural gas shortages in Europe were threatening to spill over into the US. Current IV levels at 63% are less than half of what they reached at their peak (133%, November 2022).
Source: OptionMetrics
Price declines since the beginning of the war are not confined to just the energy commodity sector but extend into cereals (wheat and corn) and base metals as well. The latter, especially copper, are often used to gauge industrial demand and economic health since they are key inputs into electronics, construction, and many renewables. After rallying earlier in the year, copper has been on the defensive as fears of weakening worldwide demand have taken hold.
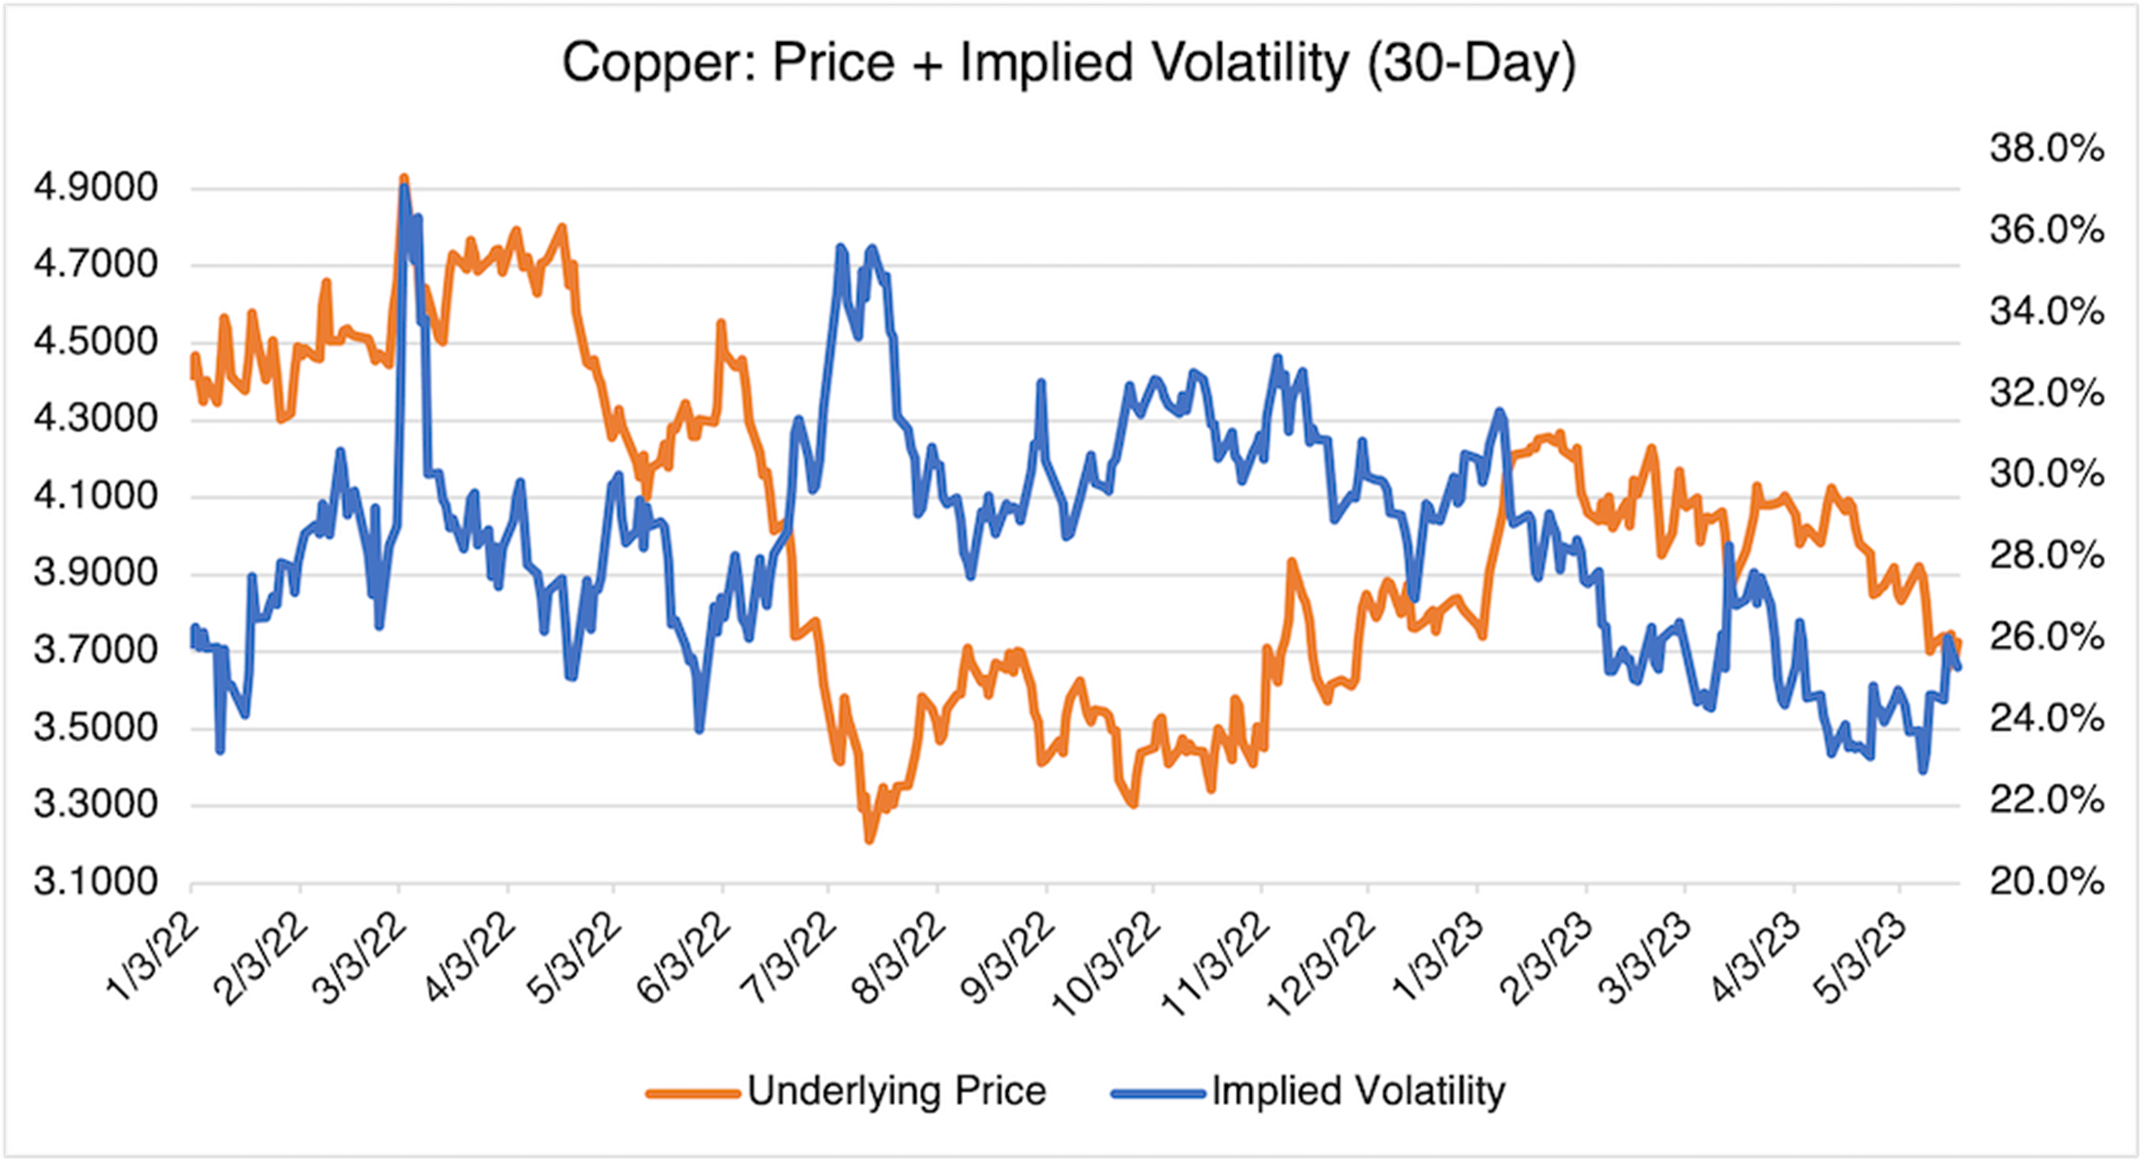
Source: OptionMetrics
Wheat and corn have also shed their wartime gains as the worst prognostications of the effects of the war have failed to occur.
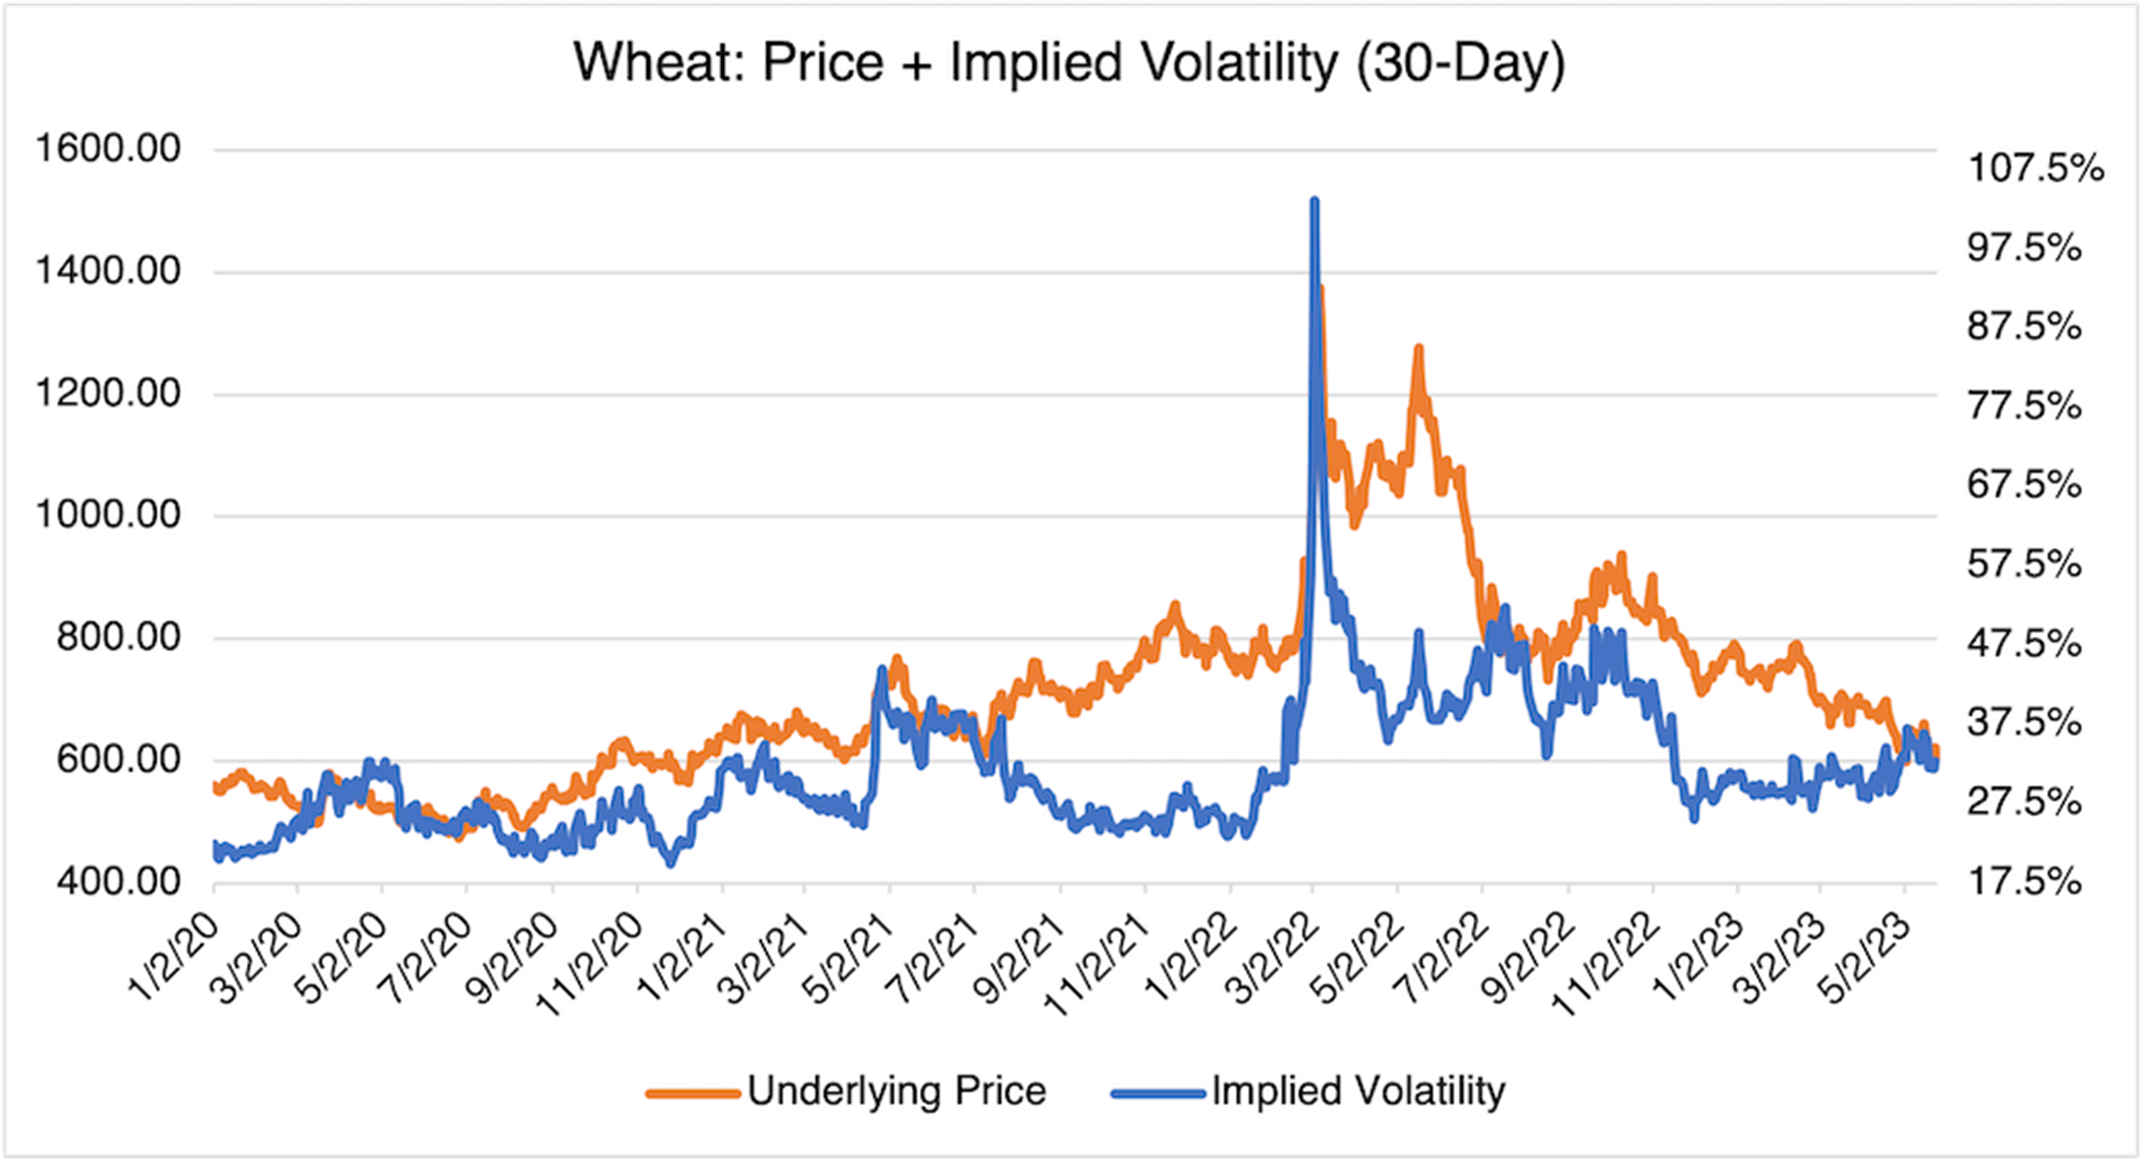
Source: OptionMetrics
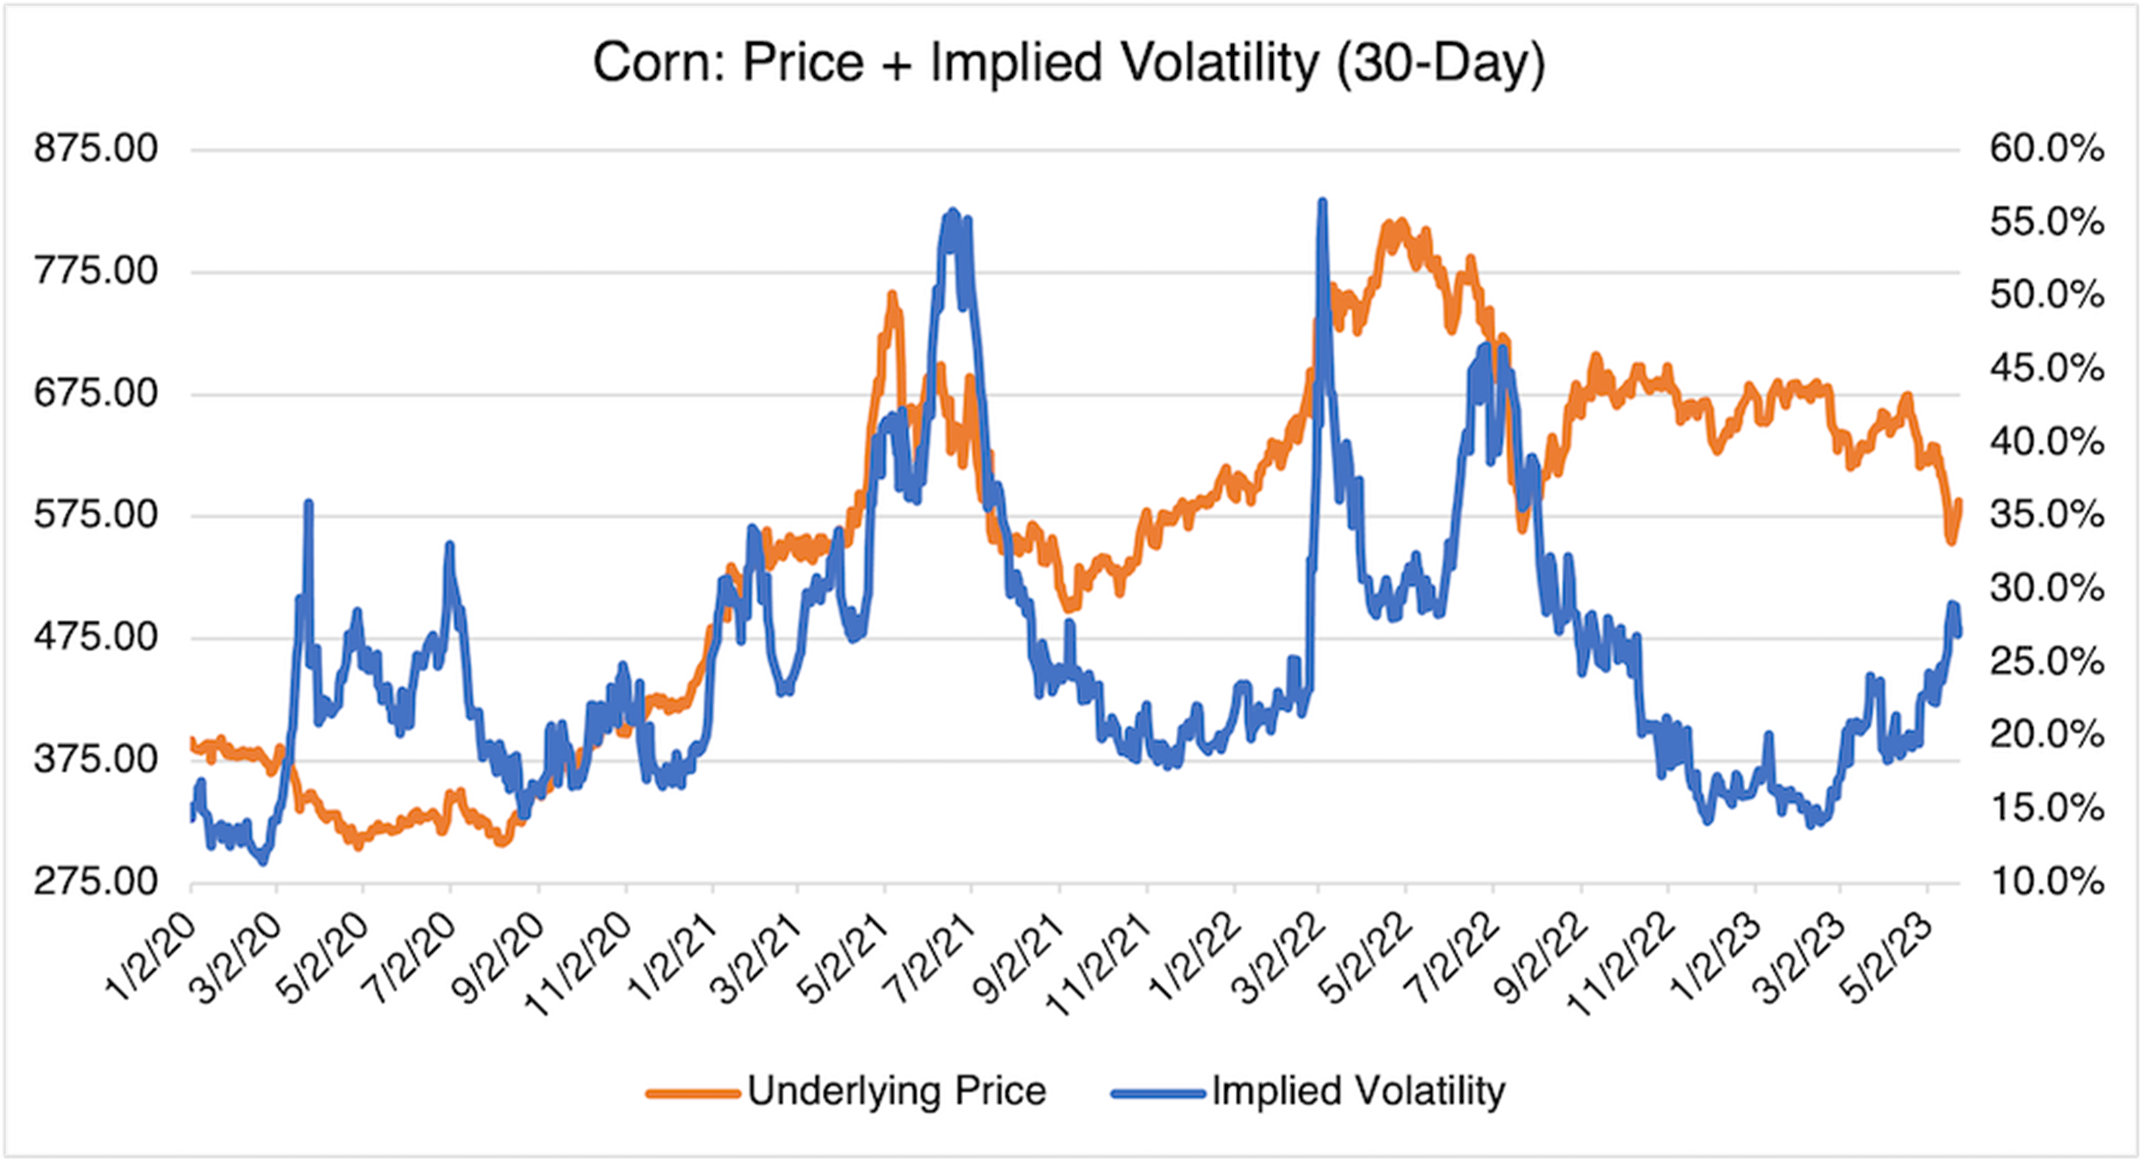
Source: OptionMetrics
In general, the sharp upwards price movement from the war in Ukraine has been eliminated. Indeed, for the commodities mentioned above, prices are below the immediate pre-war period. Worries of supply shortages have been replaced by concerns that future industrial demand, possibly spurred on by renewed growth in China, will not materialize. Energy, metals, and agricultural prices, as well as the broader GSCI index, are reflecting these concerns and possibly indicating that the market’s recessionary fears are well founded.
Learn more about Brett Friedman here.


