

Ryan Wilday of ElliotWaveTrader.net discusses where Ethereum is going in the coming months.
At its peak in July, it reached just over a 100% return from its November 2022 low. How many assets and indices can claim the same? Ether is in a similar state to Bitcoin, but a couple of indications suggest it can outperform Bitcoin concerning return during the rest of 2023.
In the background, the altcoin market is relatively weak. Even our “favored” altcoins project lower before they are likely to reverse. Ether is often considered a bellwether for the altcoin market. But Ether is unique among altcoins, in that it has followed Bitcoin to new all-time highs with each significant cycle. Of all altcoins, 99.99% have not been able to make new all-time highs in their second major cycle. Ether’s correlation to Bitcoin is relatively high, whereas other altcoins only correlate to Bitcoin during the later stages of each cycle. Ether should be considered unique among altcoins as an investible asset. Most altcoins are just trades, in our experience.
Lastly, before I get to the crux of this article, I remind you that we are traders at heart. We give levels in our articles that show where our view changes. These levels should not be confused for statements that something can go up or down. That is true, and assets can go either up or down in price, but our levels are more tactically important.
We recognize that no trader can win 100% of their trades. We use our levels to define the risk-to-reward of our trades. If the levels discussed are breached, our view changes, and likely our position.
The Case for Ether: The Higher Low
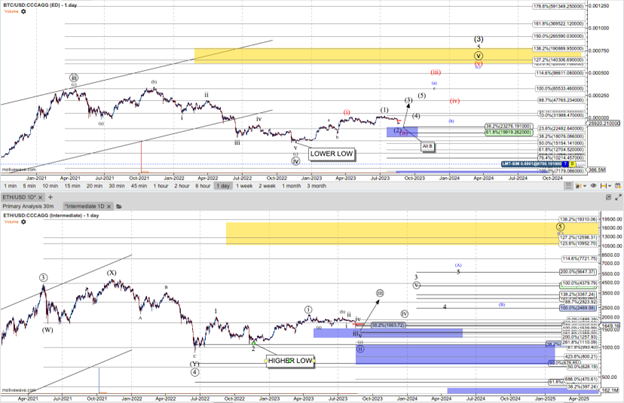
The year 2022 was brutal for crypto. As Bitcoin fell from the $65K hit in November 2021, it ushered in a year-long downtrend that dropped 77% from Bitcoin’s value to its low of $15,500 in November 2022. Ether had a similarly difficult year, dropping nearly 82%. However, Ether halted its drop in June 2022. While Bitcoin was putting in a lower low in November 2022, Ether held a low that was 22% higher than its June low. This was an early hint that the entire crypto market would start to turn higher. However, more importantly, this divergence was an indication that Ether was ready to outperform Bitcoin.
ETH/BTC
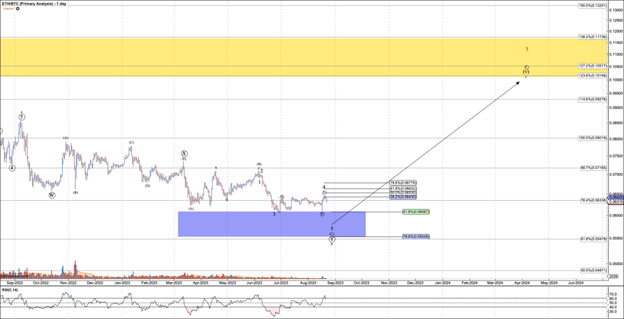
The second indication that Ether should continue to outperform Bitcoin is the ETH/BTC pair chart. This chart, similar to a Forex pair can be used as the price of Ether on a Bitcoin basis, or the price of Ether price in the US dollar, divided by Bitcoin’s price in dollars.
Since Ether’s high low in November 2022, this pair has been in a downtrend. That is to say, Bitcoin caught up to Ether since the November low. However, zoomed out, I have this pair coming into a very important support at 0.055 with the multi-year target in the 0.10 region.
As ETH/BTC is much closer to this support level than the ultimate target, the risk-to-reward favors Ether in swing trade. While I favor Bitcoin as a long-term investment which I hold in cold wallets, my swing trading accounts slightly favor the accumulation of Ether.
Zoomed out on both charts, my target for Bitcoin in the current cycle is $125K, as long as Bitcoin trades over $18K. My target for Ether is nominally $10.5K for Ethereum. That isn’t a perfect 0.10 relationship, but it takes only a small variation for there to be such a relationship.
The Next Few Months
Jason focused on the next few months in Bitcoin while I zoomed you out to the big picture for Ether, as outperformance is most likely to be evident over many months. Now I want to zoom in, as Ether has a very similar setup to Bitcoin. That is natural, as the two often show such setups in tandem.
Off of its very important November low, Ether has formed a potential five-wave structure. This structure can be interpreted as wave one of a C wave or the first of a third in impulse. Ether is a solid long setup. The difference between the two is that the former reflects the potential that the move off the 2018 low has been a diagonal, not an impulse. The reality is the five-year bull market shows characteristics of both. So I am tracking both potentials.
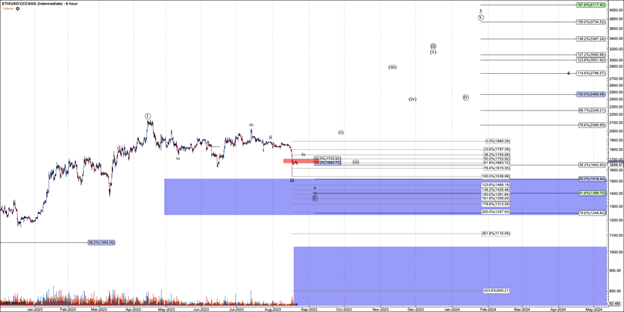
Regardless of how one sees structure in the macro sense, five waves off the November gives us support at $1250, the .764 retrace of said five waves. In micro, the large drop on August 17 is viewed as wave-iii of © of circle-ii. Resistance for wave-iv is $1700. A sustained move over that level would be the first indication the bottom may be in. But as long as $1700 holds, I expect a final drop to $1470.
The target for this setup is dependent on where the final bottom lies. But based on a bottom at $1470, this setup can take Ether to between $4700 and $5600 before a larger pullback.
Tactically speaking, I am slowly scaling into this drop. I will avoid taking aggressive positions until a reversal is evident. Provided an impulsive reversal shows, a swing trade in Ether will be the backbone of my crypto trades in the latter months of 2023.
Note that if Ether sustains under $1250 the next support levels below are $675 and $300. So that would preclude holding aggressive long positions.
Conclusion
In this article, I have discussed how Ether should be a higher performer. This applies in the immediate swing setup, forming with support at $1250 and a target of $4600+. Ether should also outperform Bitcoin into the latter days of 2023. It started to run ahead of Bitcoin in November 2022. The ETHBTC is due for an important reversal, which should propel Ether’s performance above Bitcoin’s. Finally, my cyclical targets for Bitcoin and Ether suggest Ether is due for outperformance. As always, this can change at any time, but I have expressed what levels must be maintained for this to continue—and I discussed my tactics for capturing this potential.
Learn more about Ryan Wilday here.


