

Most times investing seems fairly complicated. So many different economic reports...so many data points...and so many experts with conflicting opinions, states Steve Reitmeister of Reitmeister Total Return.
And yet sometimes...it is amazingly simple. In short, the market is bearish when the odds of a recession are high. Conversely, it is bullish when the odds of a recession are low. With that in mind let's dig into this week's Reitmeister Total Return commentary.
Market Commentary
In my Friday commentary, I noted that indeed recent economic activity was coming in better than expected. Especially true for ISM Services given the strength of retail sales. Sounds like great news, right? Wrong. Unfortunately, it had more investors worried about inflation staying too hot...which would lead the Fed to more rate hikes...which increases the possibility of a future recession forming. And thus, not surprisingly stocks headed lower once again.
This prompted me to clarify that the odds of a recession are still very low. As proof, I shared the Goldman Sachs outlook which only points to 25% odds of recession forming within the next year. However, later on that same day found that was outdated information. They have revised that down to only a 15% chance of recession given how most everything points to a soft landing. Further, they believe the last rate hike has already taken place with the lowering of rates to start in the Spring of 2024. That is a touch later than most predictions...but close enough to mainstream assumptions that all point to a bull market ahead.
Do I agree with Goldman about no more rate hikes ahead? I would say 50/50 versus getting one more quarter-point hike in November. But even more important is the timing of them switching to lower rates. I would be shocked if they made us wait til Q2 of 2024. I see that coming early to mid Q1 given that there are 6-12 months of lagged effects on Fed policy. (The longer they keep high rates in place...the more they risk recession).
Playing into all these prognostications of what the Fed will do, we must also take into account this week’s slate of inflation reports starting with CPI on Tuesday 9/13. Next up comes the lesser-followed, yet still vital, PPI report on 9/14. Once again, I recommend folks look past the year-over-year reading and dial into the month-over-month stats instead. The closer that reading gets to a 2% annual run rate...the more likely the Fed is done with rate hikes.
Price Action and Trading Plan
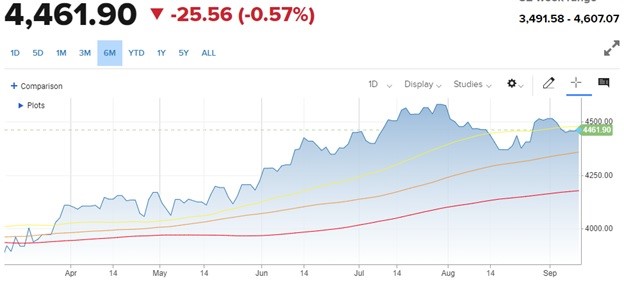
Moving Averages: 50 Day (yellow), 100 Day (orange), 200 Day (red)
The simplified version of the current price action is to say we are in a trading range awaiting the next catalyst to jump higher. And indeed, that catalyst may be the LACK of bearish catalysts allowing stocks to move higher. Plain and simple, when you are above the 200-day moving average it pays to be bullish. As shared in the intro, sometimes investing is simple. If the odds of a recession in the future are incredibly low...then that fundamentally says it is wise to be bullish.
However, much of the easy money bouncing from the bear market bottom has already been banked. At this stage, we are likely back to a more pedestrian 10-15% return for the S&P 500 in the coming year. Not so bad versus the 8% average annual return. But not going to excite the average investor either. Gladly there is a path to vastly superior results by overweighting the groups with the most upside potential such as:
Small and Mid Caps: Too many of the gains this past year, not to mention the past 3-5 years, have accrued to large caps. And yet over the long haul these smaller stocks typically outperform by a nice spread. Under the heading “reversion to the mean” small and mid-caps are due for much more impressive results in the year ahead.
Tech Played Out: So, look to other groups with earnings power and undervalued shares. Industrials, basic materials, and financials jump to the head of that list.


