

Stocks have been on a wild ride, gyrating up, down, and all around, states Alec Young of MAPSignals.
On October 9th, we told you a massive buying opportunity was looming as the BMI plunged into oversold territory. Fast forward a month and despite all the crazy chop, the S&P 500 is 3% higher and 7% off its October 27 low. Technology, long our favorite sector, has been leading the way. Today, we’ll give 3 reasons the market lows are in. We’ll even isolate the sectors to play for the upside.
OK let’s hop to it.
Three Reasons the Market Lows Are In
Soaring interest rates have been by far the biggest thorn in the stock market’s side since the July highs. Thankfully, rates have pulled back sharply, helping equities rebound. This is reason number 1 that lows are in:
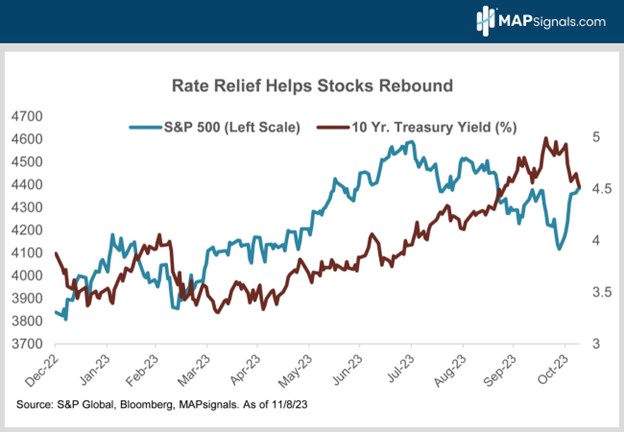
OK but how do we know yields won’t just shoot back up again? Great question. Read on.
Here are four reasons interest rates will stay below 5%:
- The Fed is likely done hiking rates thanks to Goldilocks growth and falling inflation.
- Fears of a ten-year Treasury supply glut have eased after the Treasury Department announced it would favor short-term bond issuance in 2024.
- Positioning: Shorting long bonds worked so well, for so long, that it became a very crowded trade. Now yields are falling as positioning normalizes.
- Long-term interest rates have historically been very stable when inflation is running between 2% and 4%. CPI is 3.7% now. Inflation needs to exceed 6% before we see big, sustainable jumps in 10-year bond yields. Think 2022.

OK, Let’s move to the second reason we think this rally will persist—earnings. After turning modestly negative this spring, year-over-year 12-month forward S&P 500 earnings growth has re-accelerated to 3.6%.
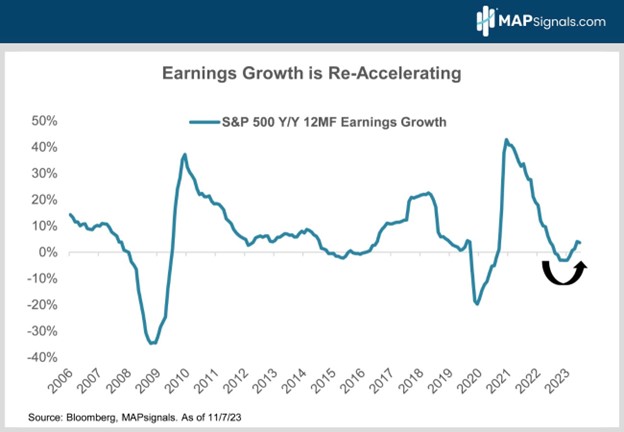
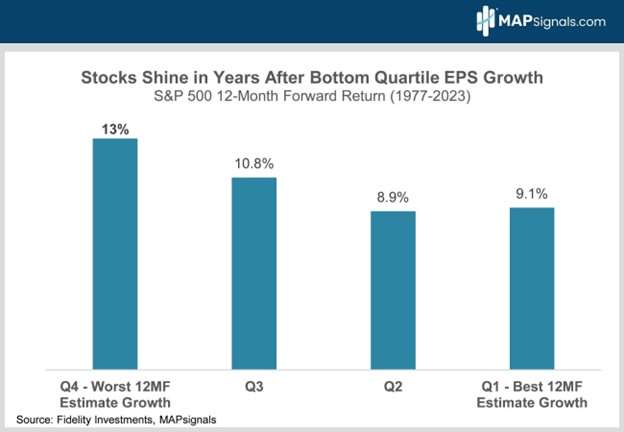
Stocks follow earnings. But here’s the best part. Since 1977, the S&P 500 has averaged a 13% gain in the 12 months following bottom quartile 12-month forward earnings growth as investors anticipate a profit recovery. When earnings turn from down to up, stocks follow suit!
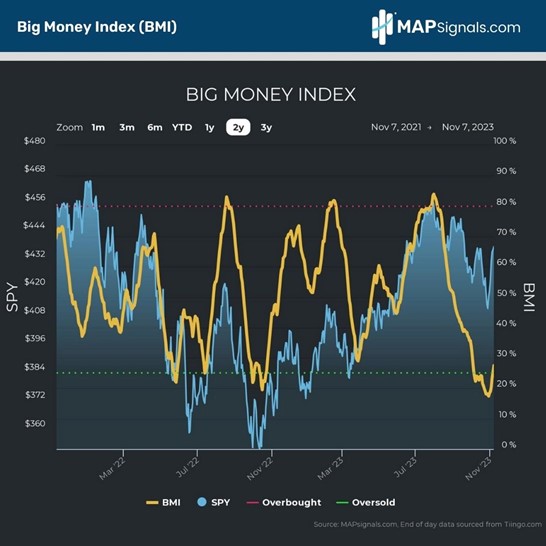
OK let’s dig deeper to see if we’re getting the same bullish message from MAPsignals’ Big Money Index (BMI). The BMI is a fantastic timing tool. Readings under 25 are rare and indicate stocks are nearing oversold levels. Said in plain English, it’s time to buy. Conversely, readings over 80 mean stocks are overbought and traders should lighten up.
The BMI rightly told you to buy stocks last October at the bear market bottom when it went oversold at 25. Then it told you to buy the dip in March when it tanked to 29. Then it nailed the July peak when it said to sell stocks as it went overbought at 84.
Let’s face it, the BMI has an amazing batting average! The BMI recently slumped down to 17, that’s the lowest reading since the 2020 Covid lows! It’s just bounced back up to 28 as the shorts have gotten squeezed. It’s telling you stocks are still really oversold and it’s time to buy. This is reason three that the lows are in. Follow the yellow brick road:
How to Play It
The macro environment is unusually uncertain right now. A recent Bloomberg survey of leading economists shows they see a 55% chance of recession in the next 12 months. It’s pretty much a coin toss. When the macro gets this murky, investors favor reliable organic growth. Earnings predictability is key.
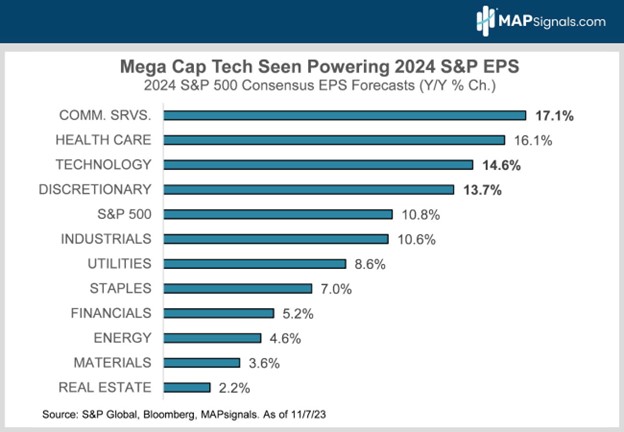
The bottom line is that when growth slows, high-quality growth stocks tend to outperform as investors pay up for reliable growth where they can find it. The Magnificent Seven fit the bill. They live in the tech, communications, and discretionary sectors—which are expected to grow their earnings much faster than the S&P 500’s 10.8% in 2024.
We’ve liked the tech and discretionary sectors all year and we’re not changing our tune now. It’s one thing to measure what’s happening now. It’s another to study historical evidence. The latter holds equal weight. We’ve recently vaulted out of oversold conditions. My colleague, Luke Downey, went back and studied all oversold periods and compiled all 12-month forward sector returns post these rare events. Since 1996, Technology stocks have been the clear run-away outperformer after reaching the green zone. On average, the Tech group surges 27% a year later. Discretionary comes in second with an 18% pop:
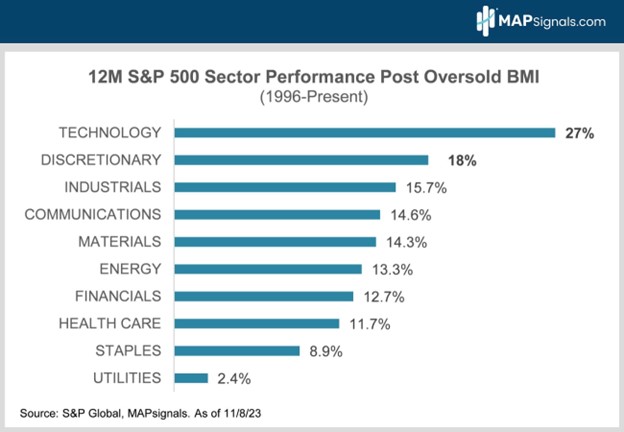
We believe the lows are in. Betting on Technology and Discretionary sectors checks the macro and historical boxes.
Bringing It All Together
This rally has further to run as interest rates likely stabilize. Goldilock growth and easing inflation mean the Fed is done tightening. Recent fears of a 10-year Treasury supply glut have eased after the Treasury Department announced it would favor short-term bond issuance in 2024. Meanwhile, corporate earnings growth is re-accelerating after troughing in May. Since 1977, the S&P 500 has averaged a 13% gain in the 12 months following bottom quartile 12-month forward earnings growth as investors anticipate a profit recovery.
Technology and discretionary stocks are likely to keep outperforming. They’ve historically done best when the BMI is rebounding from a rare oversold condition. The current macro favors them too. When growth slows, high-quality growth stocks tend to outperform as investors pay up for reliable growth where they can find it. So, there you have it. The macro is improving and an oversold BMI agrees! That’s a powerful one, two-punch!
Don’t fear the doom loop. Buy into it!
To learn more about Alec Young, visit Mapsignals.com.


