

The Empire State Manufacturing Index plummeted before the market opened on Tuesday. Subsequently, the stock market plummeted too, states Steve Reitmeister of Reitmeister Total Return.
Is that coincidence or causation? That important exploration, and what it means for the stock market going forward, will be the focus of today's commentary. The Empire State Manufacturing Index is one of the most widely followed regional economic reports. That’s because it covers the large manufacturing base in New York, which is often a bellwether for industrial activity across the country.
Well, that vital index plummeted to a reading of -43.7 on Tuesday morning. That is shockingly bad when the consensus estimate called for a reading of only -5. The worst of the component ratings was the -49.4 showing for New Orders. That forward-looking element does not bode well for what lies ahead. This news on Tuesday morning is certainly part of the mix leading to a pullback in stocks. But before you hit the panic button let’s consider a few things starting with this chart:
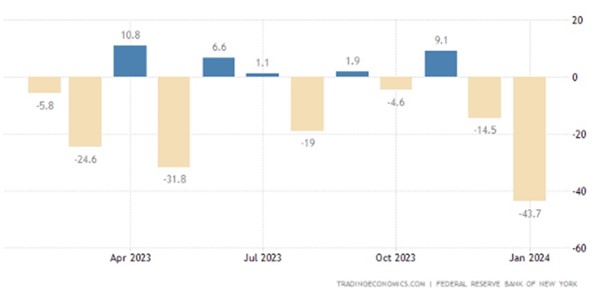
Note how bad this report has been for the past year...even though the entire time the national economy has been in positive territory and a bull market has emerged. A lot of that has to do with manufacturing being a touch weak while the much larger services sector was doing quite well. Another oddity is that also on Tuesday the ten-year Treasury rates spiked once again back above 4%. That is in great contradiction to what the weakness of the Empire State Index would imply.
This means that manufacturing reports if considered a harbinger of what is to show up in other economic reports, would have many more people worried about the likelihood of future recession. And as you know, recessions are deflationary which would have rates heading lower on Tuesday...not higher as what happened.
The point is, that investors are not reacting to the weakness in the Empire State Manufacturing Index. Especially true when broader, and more complete, readings of the economy are still quite healthy. For example, the +2.2% growth estimate for Q4 is measured by the famed GDPNow model. Are you saying that investors are once again worried about rising rates and what the Fed will do at upcoming meetings?
Not worried about that either, thanks to an impressive showing for the Producer Price Index (PPI) on Friday. Year over year that is down to only 1% inflation. Even better was finding the month-to-month PPI reading actually in the minus territory. Meaning that high inflation continues to head lower increasing the odds that the Fed will start lowering rates at some point this year. The greater mystery is whether that begins at the March, May, or June Fed meetings.
I believe that the reason for Tuesday’s stock sell-off is much more benign when you appreciate that 4,800 poses serious resistance for the S&P 500 (SPY). That’s because it equates to making new all-time highs for the stock market. It will be hard to break to those new highs without supreme confidence that the Fed will start lowering rates to spark greater economic activity which begets higher earnings growth which, as we all know, begets higher share prices.
At the earliest, that rate cut and stock catalyst may be in hand as early as March 20th where investors currently place 67% odds on a rate cut taking place. To be honest, I think it’s closer to a 50/50 chance of making the May first and June 12 meetings real possibilities. Long story short, I do not expect a meaningful stock advance until after the Fed makes the first-rate cuts. That most likely points to a trading range forming with 4,800 being the upside and the previous support area of 4,600 being the downside.
That may not be exciting...but it is not scary either. Especially true after the tremendous bull run we enjoyed to close out the year. So, to give back 3-5% shouldn’t shock anyone. Instead, this is a good time to review all your stock holdings. Which are getting rich in valuation prompting you to take profits. And which new picks, with more appealing upside, should be added back?
Our POWR Ratings are certainly helpful in that regard. We just updated the long-term performance through the end of 2023:
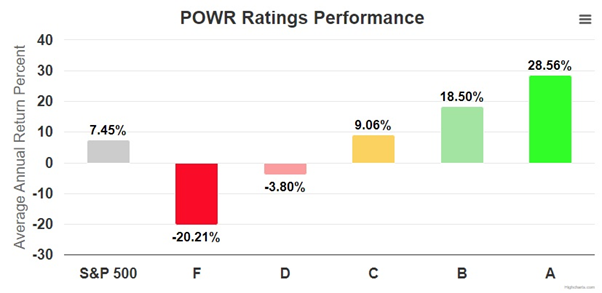
The good news of those results is the nearly 4X advantage of our A-rated stocks over the S&P 500 since the start of 1999. The bad news is that there are currently nearly 300 A-rated stocks. Too many to buy...and too many to easily research to narrow down to the ones you like best.


