

The start of the year always brings predictions of what the new year will bring, states Brett Friedman, Winhall Risk Analytics/OptionMetrics Contributor.
Among the most popular Wall Street auguries is the so-called “January Barometer," or the belief that the market's investment performance in January is indicative of the rest of the year. First popularized in 1972 by Yale Hirsch, the author of the Stock Trader’s Almanac, it resurfaces annually in the financial press. The theory goes that investors tend to put money to work in January if they feel positive about the upcoming year. In that way, its proponents are using the January Barometer as an annual sentiment indicator.
But is it true?
Using index data from OptionMetrics, we reviewed the annual returns of the S&P 500 and Dow Jones Industrial Average (DJIA) since 1996 and 1992, respectively, and compared them to the returns for just January and the first few trading days of the year. In all cases, we calculated the number of years in which positive or negative returns for January and other time periods corresponded in the same direction for each year. In other words, if the return for January was positive, did the year turn out to be positive as well? Conversely, if the return for January was negative, did the year turn out to be negative? For comparison purposes, we also compared yearly returns versus those of February, and March, the first trading day in January, and the first five trading days in January. We then expressed the results as a percentage of the total number of years in each period. The results for both the S&P 500 and DJIA are below:
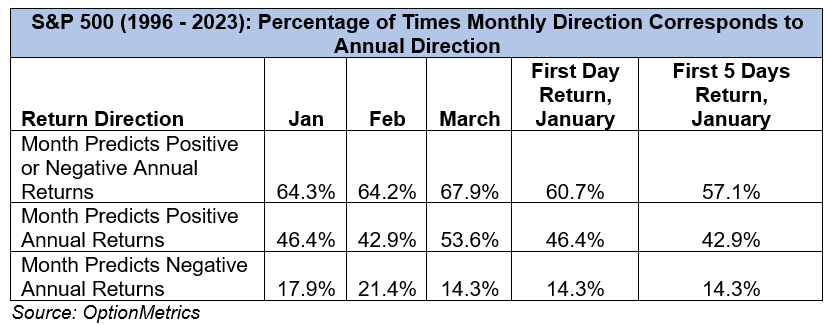
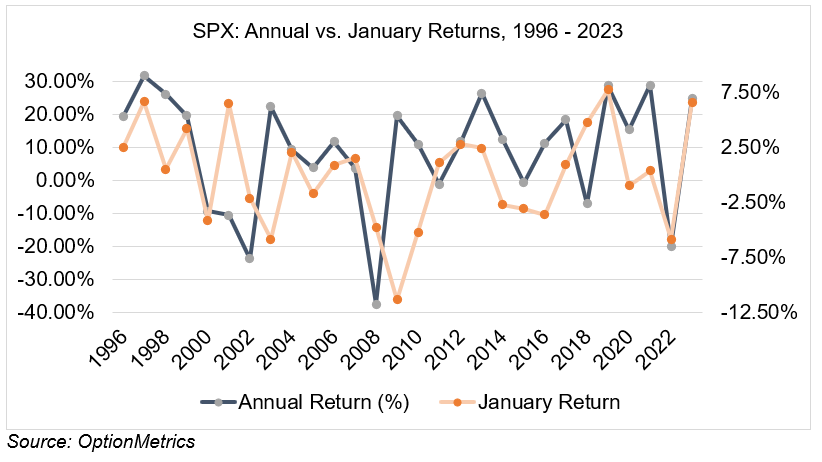
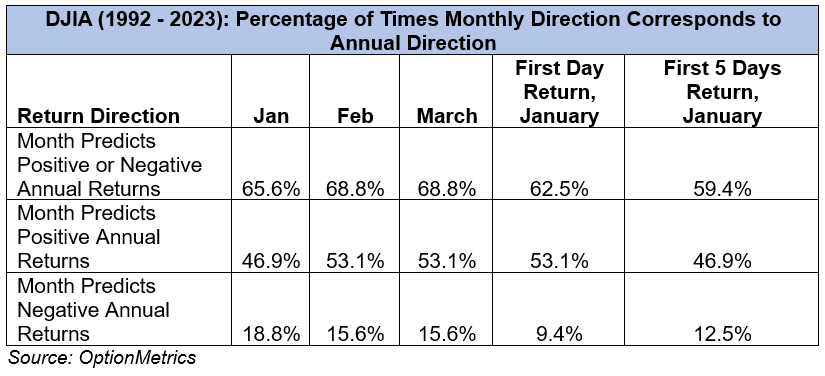
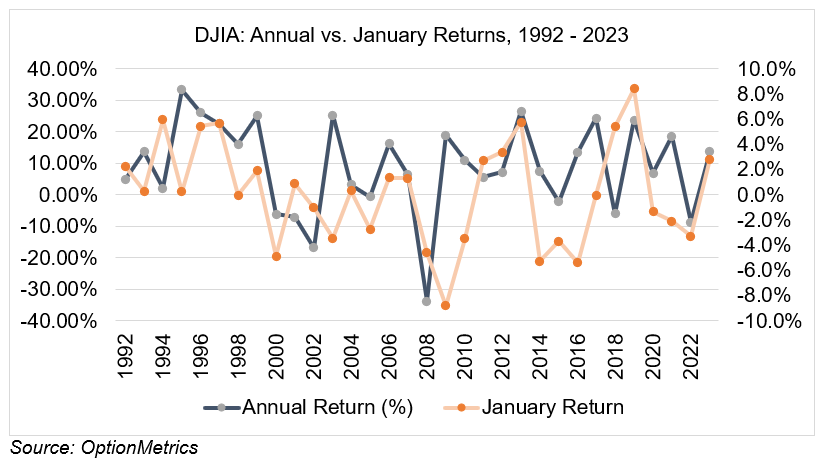
As can be seen above, the direction of January returns (positive or negative) for the S&P 500 and DJIA was the same as that of the corresponding year 64.3% and 65.6% of the time, respectively. Breaking the numbers down further, apparently, the Barometer is more accurate in predicting positive yearly returns than negative. Positive yearly returns followed positive January returns 46.4% and 46.9% of the time for both indexes; the negative cases were only 17.9% and 18.8%.
Several important qualifications should be noted regarding the January Barometer. First, February and March yield similar results to that of January, indicating that January is not unique in this regard. Second, part of the Barometer's accuracy in predicting positive annual returns is merely a reflection of the extended bull market in equity. Annual returns of the S&P 500 and DJIA have been positive 75% of the time since 1996 and 1992, respectively. Given that, the Barometer's approximate track record for predicting positive returns (46.4% and 46.9% for the S&P and DJIA) based on positive results for January is not surprising and is to be expected. The Barometer's results are therefore coincident with consistently positive annual returns and are in fact lower. In addition, the Barometer's results in predicting negative outcomes (17.9% and 18.8% for the S&P and DJIA) are unimpressive. In short, there appears to be nothing predictive about January returns, or the Barometer itself, that is not true of other months or mirrored in the markets' long-term trend.
Brett Friedman has built and managed three risk management organizations, and two trading startups, and has transacted on numerous exchanges and OTC markets. He is with Winhall Risk Analytics and is an OptionMetrics contributor.
Prajwal Pitlehra, a FRE candidate at the NYU Tandon School of Financial Engineering, assisted in the production of this article.


