
Watch for short-term rallies in stocks and commodities in the very short term, advises trader Chris Vermeulen, who reviews the key factors currently driving these markets.
This summer should be an exciting one for traders. While summer trading generally tends to be slow, this one could be different. A large number of other professional traders I talk with are all feeling the tension building in the market. We all think some big movements are just around the corner, and the big question is regarding which way things are going to move.
Depending on your trading style, you may be viewing the recent market action as the beginning stages of a bear market (major selloff). A bear market is not necessarily impossible, as the US economy is showing the beginning signs of weakness. The fact that stocks have moved lower for almost six straight weeks is a recent reminder that we may not be out of the woods just yet. The recent price action and negative sentiment has been harsh enough to make 99% of traders bearish.
In contrast, some traders may be seeing this market as an oversold dip preparing for a bounce/rally in the bull market that we have been in since 2009. Some traders may see this as a buying opportunity because they are contrarians, and most contrarians generally want to do the opposite of the masses (the herd), which is trading purely out of emotional sentiment.
I myself have mixed thoughts on the market at this point in time. I’m not a big-picture kind of guy, but my trading partner, David Banister, is great at it.
Rather, I am a shorter-term trader, catching extreme sentiment shifts in the market with trades lasting for three to 60 days. So looking forward two to five days, I feel as though stocks and commodities are going to bottom and start to head higher for a 2%-6% bounce.
At that point, we need to regroup and analyze how the market got there: Was the buying coming from the herd, institutions, or was it just a short-covering rally? Additionally, where are the key resistance levels, and did we break through any already?
During extreme sentiment shifts in the market, we tend to see investments fall out of sync with each other for a few days. I feel the attention will be on stocks and we will get a bounce this week. I am expecting commodities to trade relatively flat during the same time period. Let’s now take a quick look at the charts.
NEXT: Latest Charts for Dollar Index, Oil, and More
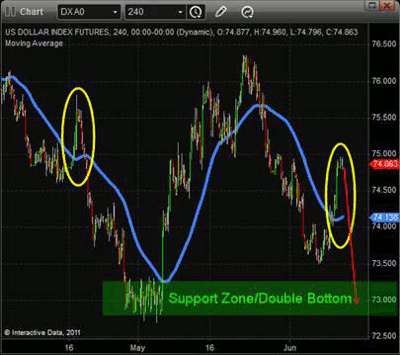
|pagebreak|Dollar Index Four-Hour Candles
I feel as though the US dollar is trying to bottom. It is very possible that we will test the May low, at which point I would expect another strong bounce and possibly a multi-month rally.
So if the dollar drops to the May lows, we should see higher stocks and commodities, but once the dollar firms up and heads higher, it will be game over for risk assets.
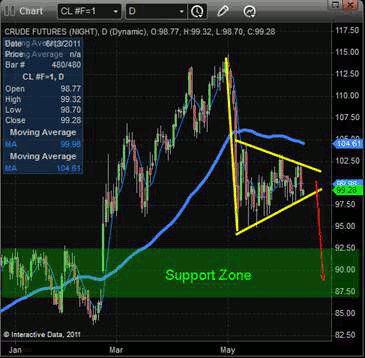
Crude Oil Daily Chart
Oil took a swan dive in early May and has yet to show any signs of moving higher. Actually, crude oil is looking more and more bearish as time goes by.
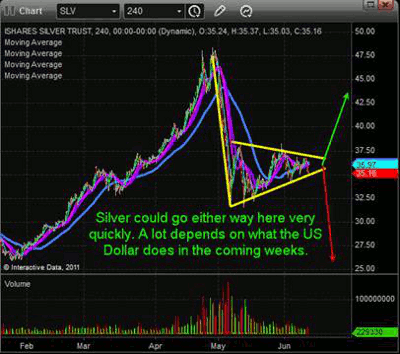
Silver Four-Hour Chart
Silver (iShares Silver Trust (SLV)) has formed much the same pattern as oil. On a technical basis, it’s pointing to sharply lower prices still. The fact that silver bullion went from an investment to a speculative trading instrument within the past eight months makes me think it could test the $25 area. The one thing to remember here is that silver is still overall in a bull market. This is a 50/50 guess, in my opinion, as it nears the apex of this pennant pattern.
NEXT: See What's Next for Gold and the S&P 500
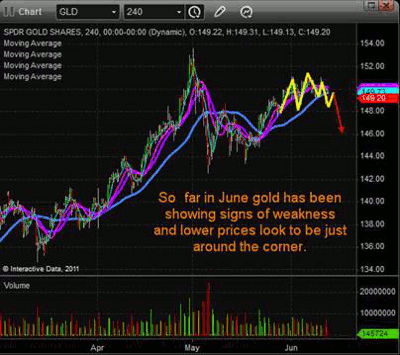
|pagebreak|Gold Four-Hour Chart
Gold (SPDR Gold Trust (GLD)) has held up much better than other metals and commodities, and I feel that is because it’s still seen at the real safe haven. But reviewing the chart, I’m starting to see bearish price action taking place.
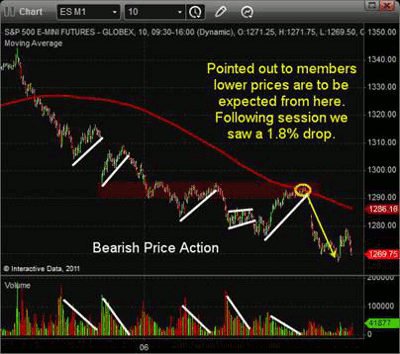
S&P 500 Futures (Ten-Minute Chart for Eight Days)
Last week, the S&P 500 continued to show signs of weakness. Any bounce in the market was on light volume, and that is because the sellers took a break and let all the small traders buy the market back up. But once the market moved up enough, sellers jumped back in and unloaded their shares.
Last Thursday (June 9), I sent out an update to members pointing out that lower prices were to be expected. I came to this conclusion because of many data points. Looking at the chart below, you can see sellers are clearly in control.
The S&P 500 bounces high enough that it reached a key resistance level going back five days. Also, the 200-period moving average (MA) was at that level. To top that off, my sentiment reading for the herd mentality was at a point where sellers like to start dumping their shares again.
Weekly Trading Conclusion
In short, I am getting more bullish about a bounce as the market falls, but once we are into day three or four of a bounce, we must be ready to take profits and/or look for a possible short set-up.
By Chris Vermeulen of TheGoldAndOilGuy.com


