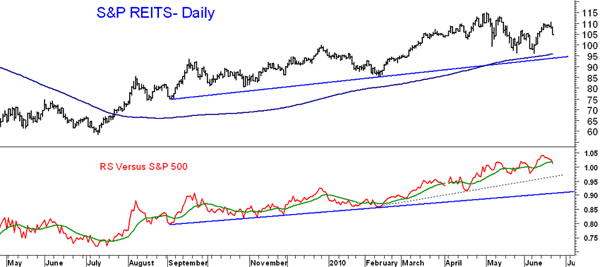
All of the major sectors were hit on Tuesday and most closed the day near lows. One of the best-performing stock groups over the past month is the S&P REITs, which shows a pattern of higher lows and higher highs throughout the past year. The REITs held above both the trend line and the rising 200-day MA on the recent market decline. The RS plot shows that the REITs are continuing to outperform the S&P 500 and are above both the short- and long-term uptrends.
Tom Aspray, professional trader and analyst, serves as video content editor for MoneyShow.com. The views expressed here are his own.


