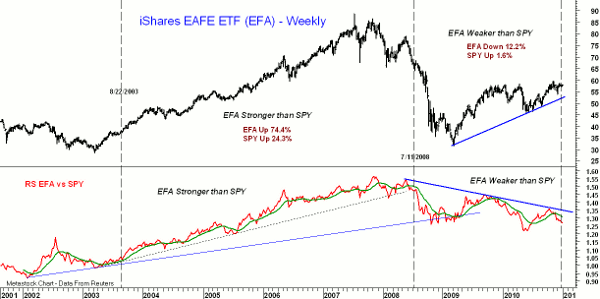
Chart Analysis: In adjusting one’s portfolio mix, it is always hard to decide how much to invest in the US and how much in the global markets. Then, when looking at the global markets, which ones you should be invested in? The iShares MSCI EAFE Index Fund (EFA) includes stocks from Europe, Australasia, and the Far East. It is non-diversified and is widely followed as a measure of international stock performance. The long-term chart starts in late 2001 and is updated through December 28, 2010.
On the bottom of the chart, I have plotted the RS, or relative performance, of EFA versus the S&P 500 ETF (SPY). When the RS (in red) is rising, EFA is acting stronger than SPY, and when it is falling, EFA is acting weaker. From August 22, 2003, through July 11, 2008, the RS was positive as it was forming higher highs and higher lows with its uptrend intact. During this period, EFA was up 74.4% while the SPY was up only 24.3%. Since July 11, 2008, the RS has made lower highs and is in a well-defined downtrend. During this period, EFA is down 12.2% while the SPY is up 1.6%. There are no signs that this relationship is changing as the chart of EFA also looks much weaker than that of the major US indices.
What It Means: During the time periods discussed, the difference in performance is dramatic. The current analysis suggests that US stocks, and specifically SPY, will continue to outperform EFA. This is another strong example of how relative performance analysis can be a valuable investing tool.
How to Profit: As you start to look at your portfolio allocation for 2011, this analysis suggests that in terms of the US versus the developed international markets as represented by EFA, your portfolio should be overweighted in favor of the US. Next week, we will examine how SPY compares to the emerging markets.
Tom Aspray, professional trader and analyst, serves as senior editor for MoneyShow.com. The views expressed here are his own.


