No one can argue or dispute the long-term success of Warren Buffett, as he is well deserving of the accolades he receives. As a technical analyst, it is interesting to take a look back at some of Buffett’s recent holdings to see if even the most basic technical analysis might have alerted him to changes in a stock’s trend. In the latest reporting, there were quite a few changes in the holdings of Berkshire Hathaway (BRK-A) at the end of 2010, and I will focus today on Bank of America (BAC) and Nike Inc. (NKE), which were sold from the portfolio.
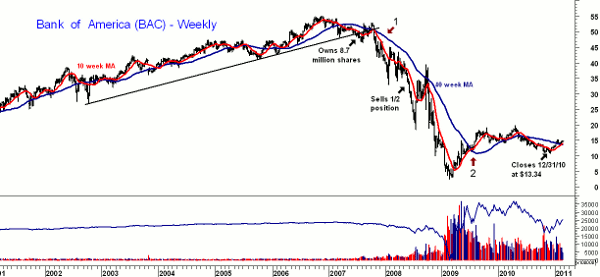
Chart Analysis: Some of the changes in the holdings of Berkshire Hathaway have been attributed to the retirement of a longtime manager, but press reports* have suggested that Mr. Buffett was more involved in the decisions regarding BAC. In the second quarter of 2007, Buffett held 8.7 million shares, and that position increased to 9.1 million at the end of the third quarter. BAC peaked at $52.94 at the start of the fourth quarter in 2007.
- The ten-week moving average (MA) dropped below the 40-week by late October 2007 (point 1). (The 10-/40-week MAs are analogous to the 50-/200-day MAs)
- It was reported that half of Berkshire’s position in BAC was sold in the second quarter of 2008, and BAC broke important support in May
- The chart shows a pattern of lower highs and lower lows, i.e. a downtrend, until the middle of 2009, and soon afterwards, the 10-/40-week MAs turned positive (point 2)
- The rebound in BAC peaked in April 2010 at $18.86 and it closed the year at $13.34
- The 10-/40-week MAs have just crossed again, but it would take a move above the last high at $15.31 to confirm a new uptrend
- Key support on the daily chart is at $13.88
- Neither the weekly or daily on-balance volume (OBV) are giving any strong signals
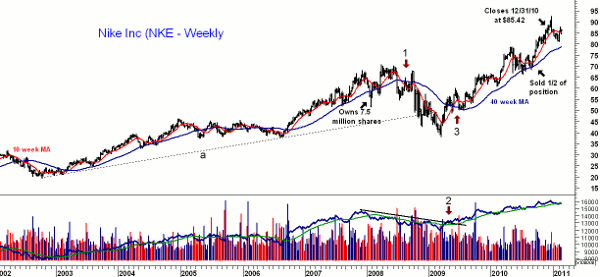
The weekly chart of NKE shows a much more positive long-term uptrend, but it also has been quite volatile. The position in NKE stayed pretty constant from the end of 2007, when Berkshire held 7.5 million shares, until the third quarter of 2010, when half was sold at a reported average price of $72.97
- The ten-week MA dropped below the 40-week in August 2008 (point 1), and the long-term uptrend, line a, was broken in November 2008
- The weekly OBV turned positive in May 2009 (point 2) and the 10-/40-week MAs turned positive in June (point 3)
- Since June 2009, the weekly chart shows a pattern of higher highs and higher lows, i.e. an uptrend
- NKE closed 2010 at $85.42 and peaked at $89.64 in January 2011. Berkshire’s remaining NKE position was sold in the fourth quarter of 2010
- NKE has bounced from good support in the $81 area and has first resistance now at $86.88
- The weekly OBV is positive and continues to make hew highs with prices
- The daily OBV is positive and shows a bullish pattern
What It Means: Clearly no one should draw any significant conclusions from these two examples, though from a technical perspective, Berkshire’s position in BAC was held for too long. Over the years, I have had countless debates with non-technicians about the merits of using stops, and this is a great example of why you should always have a stop on all positions. The decision in May 2008 to sell half the position in BAC was well timed, but they did not get a great price in late 2010.
As for NKE, stops could have sidestepped the downdraft in 2008 and early 2009, but of course, that might have led to missing the dramatic rally from the 2009 lows. The weekly and daily charts of NKE look technically positive, suggesting that Buffett should have held on to the NKE position a bit longer. On core holdings in NKE, a stop under $80 would be reasonable.
How to Profit: From a technical perspective, I see no reasons to take a long position in BAC at this time and at current levels. NKE does look much more attractive, and longs could be established at $85.77 or better with a stop at $82.47 (risk of approx. 3.9%). I would sell half the position at $91.41.
Tom Aspray, professional trader and analyst, serves as senior editor for MoneyShow.com. The views expressed here are his own.
NOTE: Past and current holdings of Berkshire Hathaway, and changes to those holdings, have been derived from press reports that are deemed reliable.


