High-volume selling seen in these stocks can serve as a potential early warning signal that it’s time to take profits, sell altogether, or even play the short side using put options.
As I discussed in detail last week, volume plays an important role in the process I use to find and recommend stocks to buy. The same volume scan can also alert the investor or trader to stocks that are under unusual selling pressure. An early warning of a change in trend can often be given by a significant increase in volume.
If you are long a stock that weakens on unusually high volume, take a hard look at the technical reading so you can determine whether longs should be sold or stops should be raised. Traders can also use this analysis to find stocks to sell short or buy puts against.
The same sort of entry and stop analysis that is used on long positions should be used on short positions as well. These three stocks showed up on my latest volume scan following Tuesday’s close.
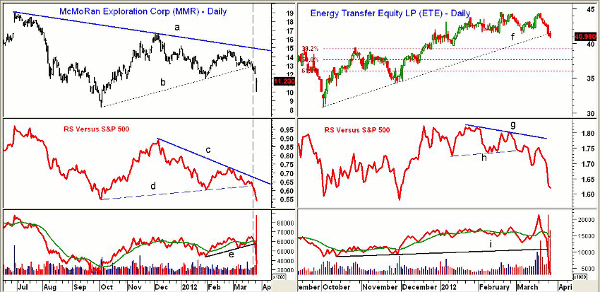
Chart Analysis: McMoRan Exploration Corp. (MMR) is a $1.8 billion independent oil and gas company. The stock was down 7.6% on Tuesday on volume of over 20 million shares, which is almost eight times the daily average.
- The daily chart shows that MMR closed below the uptrend, line b, last Thursday
- Next good support is in the $10 area with more important support at the October 2011 lows at $8.25
- The break of support was confirmed by the relative performance, or RS analysis, as it also violated support at line d. The RS line had formed sharply lower highs, line c
- Tuesday’s very high volume is evident on the daily chart, and the on-balance volume (OBV) broke support, line e, on Monday
- MMR is likely to rebound after the recent sharp drop. Initial resistance is at $11.55 and stronger resistance is at $12-$12.50. It would take a daily close above $13.20 to suggest the trend had changed
Energy Transfer Equity LP (ETE) is a $9.1 billion oil and gas pipeline limited partnership. It currently yields 6.1%. On Monday, the company completed its $5.5 billion merger with pipeline company Southern Union Co.
- The uptrend going back to the October low, line f, was broken with Monday’s close
- Next support is in the $39.20-$39.60 area, which includes the 38.2% Fibonacci retracement support
- The 50% retracement support level is at $37.63
- RS analysis topped out in early March when support at line h was decisively broken. The RS line had diverged from prices, line g, at the recent highs
- OBV dropped below its weighted moving average (WMA) on March 21 and broke below support, line i, on Monday
- First resistance is at $41.20-$41.60 with much stronger resistance at $42.60-$43
NEXT: Unusual Volume Seen in Shares of This Big Bank
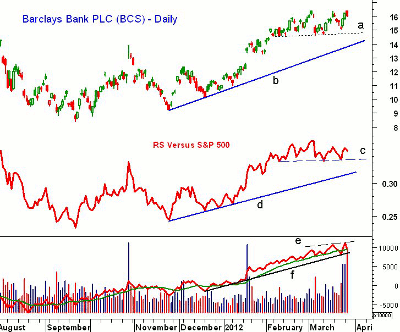
|pagebreak|Barclays Bank PLC (BCS) is a $48.7 billion money center bank that currently yields 4.60%. Tuesday’s volume of 18.5 million shares was over three times the daily average.
- BCS opened Tuesday at $16.41, which was just above the prior twin highs of $16.34 and $16.38
- Next support is now at $15.08 with more important support at $14.75, line a. A close below this level will confirm a daily top
- The uptrend, line b, is now in the $14 area
- The RS line has formed lower highs over the past two months, and a drop below support at line c would be consistent with a top
- More important RS line support is at line d
- Daily OBV is still above its uptrend, line f, and did make marginally higher highs, line e, on Monday
- Once above $16.41, there is further resistance at the July 2011 high of $17.19
What It Means: It is a good idea for all investors to keep an eye on the volume levels of the stocks in their portfolio. Whenever daily volume is more than double the 30-day average, it is providing the investor with information that should not be ignored.
McMoRan Exploration Corp. (MMR) is getting oversold in the short term and is likely to rebound.
Energy Transfer Equity LP (ETE) and Barclays Bank PLC (BCS) both appear to be completing daily top formations. As part of the learning process, they would be good stocks for investors to watch. If the volume surge is an early warning that investors are starting to dump these stocks, then key support should be broken in the near future.
How to Profit: Put buyers should observe the same sort of technical rules that stock investors follow. The entry point is very important, as puts should be purchased when the stock rallies back to resistance. It will require more discipline, but often times, mental stops based on the stock price often work better than stop levels on the individual options.


