Crude oil has been attempting to break out above its 2011 top this year, and MoneyShow’s Tom Aspray takes a technical look to see if it will succeed this time and which stock might benefit if it does.
Stocks were a bit mixed Monday, as while the S&P 500, Dow Industrials, and Dow Transports closed lower, the NYSE Composite was higher. The market internals were much stronger than prices.
As most commodity markets have dropped this year, crude oil has bucked the trend with the July Crude Oil contract up 3.4%. The combination of high inventories and relatively low demand has some analysts convinced that crude oil prices may be due for a sharp drop.
The bulls apparently are betting on future economic growth to fuel greater demand and as consumers have noted, gas prices have started to rise ahead of the Memorial Day holiday. The technical outlook for crude oil suggests that we are close to a critical juncture and one oil stock looks ready to move even higher.
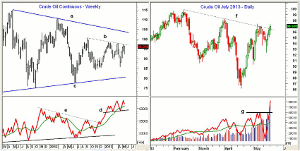
Chart Analysis: The weekly chart of the continuous crude oil contract shows that it closed last week almost $4 above its lows and just below the resistance from last fall at line b.
- A decisive close above the February highs will signal a move to the $103-$105 area.
- This corresponds to the downtrend from the 2011 and 2012 highs, line a.
- The weekly OBV turned down last week but is still well above its WMA.
- A higher close this week could trigger an upside breakout while a drop below the support at line d, would be negative.
- The OBV breakout in December 2012 and the fact that the OBV has already exceeded the 2011-2012 highs does favor the upside.
- There is key support on the weekly chart at $85.60.
The July 2013 Crude Oil contract did close above its downtrend, line f, on Monday. The next resistance is at $98.22, which was the April 1 high.
- The high on February 13 is at $99.77 while the 127.2% Fibonacci retracement target is at $103.50.
- The volume was heavy Monday as the OBV has surged above the resistance at line g.
- Therefore the multiple time frame OBV analysis is bullish and favors higher prices.
- The July contract has first support at $94.80-$95 with further at $92.40.
NEXT PAGE: A Bullish Sign for One Stock
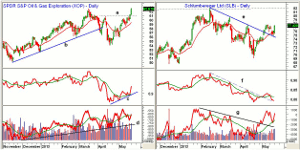
|pagebreak|The Select Sector SPDR Energy (XLE) closed near the daily starc + band on Monday with the weekly starc+ at $83.80.
- The long-term resistance at $81, which goes back to the May 2011 highs, line a, was overcome last week.
- The upper boundary of the weekly trading channel is at $88.20.
- The relative performance has completed its short-term bottom formation as it closed above its prior high.
- The RS line is in a short-term uptrend, line c.
- The OBV broke out to new highs in April and has been leading prices higher.
- On Monday it closed back above its rising WMA.
- For XLE there is initial support at $81-$81.75 with stronger at $79.50-$80.
Schlumberger Ltd. (SLB) broke its downtrend, line f, on May 6 and rallied to a high of $77.69. There is next resistance at $79.74.
- There is major resistance, line e, in the $82 area, which goes back to the February highs.
- The relative performance broke its downtrend, line g, in early May.
- A move in the RS line above its prior high will complete the bottom formation.
- The on-balance volume (OBV) broke through its downtrend, line h, at the end of April.
- The OBV tested its rising WMA on the pullback last week and has again turned sharply higher.
- The pullback last week took SLB back to its 20-EMA and retested the former downtrend.
- For SLB there is minor support in the $76-$76.40 area with the quarterly pivot at $75.56.
- There is more important support in the $73.50-$74 area.
What it Means: The upside breakout in the July Crude oil contract and in the Select Sector SPDR Energy (XLE) does favor higher crude and a bullish environment for the energy stocks.
It has been a choppy year so far for crude oil, and this week’s close should clarify the outlook.
I like the technical action in Schlumberger Ltd. (SLB) but would cancel the order if stronger resistance is hit before our buy levels.
How to Profit: For Schlumberger Ltd. (SLB), go 50% long at $77.06 and 50% at $76.28 with a stop at $72.94 (risk of 4.8%). Cancel if $79.50 is hit first.


