This sub-sector has been outperforming for most of this year, and MoneyShow’s Tom Aspray examines the charts of three biotech stocks reporting earnings this week to see what course of action to take.
The market opened lower Monday in reaction to the weakness in Japan with seven of ten sectors closing the day lower. The financial, energy, and consumer discretionary sectors were the weakest.
The market internals were negative and the majority of A/D lines have dropped below their WMAs, which is a sign of weakness. This is consistent with a loss of upside momentum as we head into a full week of economic data. Later today we get the S&P Case-Shiller Housing Price Index and Consumer Confidence.
One of the top industry groups of the past year has been the S&P Biotechnology Index (DJUSBT), which rose over 83% since the June 2012 lows. During the same period, the Spyder Trust (SPY) has gained over 32%.
The relative performance analysis on the healthcare sector, as well as biotechnology, has indicated they have both been leading the market higher since May of 2012. Some of the market-leading biotech stocks report earnings this week but what, if anything, should holders of these stocks do before the earnings come out?
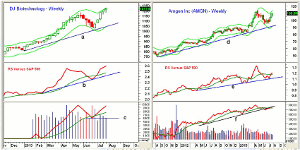
Chart Analysis: For the past three weeks, the DJ Biotechnology Index (DJUSBT) has been testing the weekly starc+ band and is currently above its monthly starc+ band.
- The Index moved above its 2012 highs in the first two weeks of the year, which was a positive sign from the yearly analysis.
- Using the correction from the May high to the June low, the 127.2% Fibonacci retracement target is just slightly above current levels.
- The weekly relative performance briefly dropped below its WMA during the correction but has not confirmed the recent highs.
- The weekly OBV dropped below its WMA for one week before resuming its uptrend.
- The OBV is close to making new highs and the daily (not shown) has confirmed the highs.
- There is key weekly OBV support at line c.
- There is first support now at 1160 with further at 1100.
Amgen Inc. (AMGN) is a giant $82 billion dollar biotech company that has a current yield of 1.70%. It reports earning after the close on July 30.
- The last quarter AMGN had a positive surprise as it beat forecasts by 11%.
- Many analysts are predicting an earnings beat again this quarter.
- AMGN spent six weeks trading near its weekly starc+ band before peaking at $114.95 in May.
- Six weeks later it tested the starc- band as it hit a low of $94.21.
- AMGN has not yet moved above the May highs with first support in the $101-$103 area.
- The relative performance did confirm the May highs and is now back above its WMA.
- The weekly OBV has just rebounded back to its year-long uptrend, line f, that was broken in June.
- The monthly analysis (not shown) is positive and has confirmed the highs.
NEXT PAGE: 2 High-Risk Biotech Stocks
|pagebreak|Cadence Pharmaceuticals Inc. (CADX) is a small-cap ($646 million) biotechnology company that reports earnings after the close on July 31.
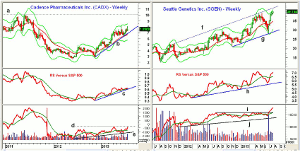
- CADX completed a weekly double bottom formation in 2012 and the initial upside targets at $7 have already been met.
- The next major resistance from 2011 is in the $10 area.
- The weekly relative performance bottomed in early 2013 and the gradual uptrend (line c) indicates it is acting stronger than the market.
- Volume was high last week and a move in the OBV above the resistance at line d would be positive.
- The monthly and quarterly pivot levels are at $7.11-$7.13.
- The gradual weekly uptrend (line b) and first support is in the $6.90-$7 area with the rising 20-week EMA at $6.70.
Seattle Genetics Inc. (SGEN) is a $4.80 billion biotech company that is scheduled to report its earnings after the close on July 31.
- Its stock has closed near its weekly starc+ band for the past two weeks.
- The band is at $40.98 with the trend line resistance at $41.71, line f.
- The relative performance moved back above its WMA three weeks ago but is still below the previous highs.
- The RS line shows a clear uptrend, line h.
- The OBV has broke through its year long resistance, line i, on July 6 as volume has been positive for the past five weeks.
- There is first support for SGEN at $37-$38.20 with more important in the $35 area.
What it Means: The biotechnology sector as well as Amgen Inc. (AMGN) and Seattle Genetics Inc. (SGEN) are all near their weekly starc+ bands suggesting they are in a high-risk buy area. If you have good profits in either or both of these stocks and have not taken any profits this year, now seems like a good time to do so. As I mentioned in 4 Ways to Summer-Proof Your Portfolio, taking profits and raising cash during the summer months can put you in a better position when we get to the seasonally positive fall period.
I will also be looking for a pullback in iShares Nasdaq Biotechnology Index (IBB) to buy.
Cadence Pharmaceuticals Inc. (CADX) does look attractive on a pullback as risk control is even more important in lower priced stocks.
How to Profit: For Cadence Pharmaceuticals Inc. (CADX), go 50% long at $7.14 and 50% long at $6.92, with a stop at $6.65. (risk of approx. 5.4%).


