Since three stocks were replaced in the Dow Industrials last September, pundits have been speculating whether they have been a drag on the index, so MoneyShow’s Tom Aspray takes a technical look to see if there’s any evidence to support this conjecture.
The Dow Industrials led the market on the downside, Tuesday, but it really masked the strength in the overall market as the NYSE Composite was up 1.78%. The advancing stocks led the decliners by a 2-1 margin and the NYSE Advance/Decline made another new all-time high Tuesday as it continues to lead the market higher.
The Dow Jones Utility Average was up over 1% with the small-cap S&P 600 gaining 0.57%. Earnings after the close from International Business Machines (IBM) and Texas Instruments (TXN) pushed both stocks lower in after-hours trading. The Dow futures are lower in early trading.
It has been a tough week for Dow stocks who reported earnings as Johnson and Johnson (JNJ), Verizon Communications (VZ), and Travelers (TRV) all dropped over 1% in initial reaction to their earnings report. These losses offset the sharp 6.6% gain in Dow Chemical (DOW) as an activist hedge fund reported it had taken a large position in the stock.
Last September 23, three new stocks: Visa Inc. (V), Goldman Sachs (GS), and Nike Inc. (NKE) were added to the Dow Industrials. GS received its share of the blame for the Dow’s loss as it was down 1.75% on Tuesday. Some think that the three new stocks have been dragging the Dow lower, but is this really the case?
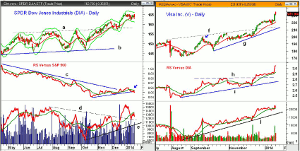
Chart Analysis: The SPDR Dow Jones Industrials (DIA) shows that it has been testing its 20-day EMA over the past week. DIA is not far below its recent high at $165.51.
- Since September 23, DIA is up 6.6% versus an 8.3% gain in the Spyder Trust (SPY).
- There is next support in the $161.58 to $162.14 area.
- The breakout from the trading range, lines a and b, last November was positive with outstanding upside targets in the $167-$168 area.
- The key quarterly pivot is at $159.31, and as noted last week, the R1 is at $171.67 and R2 at $177.86.
- The relative performance had been in a shallow uptrend from the October lows as the daily downtrend, line d, was slightly broken.
- The RS has deteriorated over the past week as it dropped below its WMA and its uptrend (see arrow).
- The OBV surged in December and broke its downtrend, line d.
- The OBV has since dropped below its WMA and has retested the breakout level with more important support at line e.
Visa Inc. (V) was up sharply last Friday on double the average volume. Since September 23, V is up 18.4% beating the gain in the SPY by over 10%. It is scheduled to report its earnings on January 30.
- The daily chart shows the strong move through resistance, line f, in the middle of December.
- The rising 20-day EMA at $218.60 was tested on January 19 before the latest surge.
- The weekly starc+ band at $234.98 was exceeded this week with the monthly projected resistance at $238.23.
- The relative performance broke through resistance (line h) ahead of prices and continues to indicate it is a market-leading sector.
- The weekly RS line (not shown) has also confirmed the new highs.
- The daily OBV shows a strong uptrend from last Augusts lows, line j, and did make new highs last Friday.
- There is initial support now at $226.50 and then $224.24 with the quarterly pivot at $214.94.
NEXT PAGE: 2 Dow Components to Watch
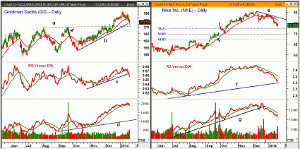
|pagebreak|Goldman Sachs (GS) dropped below its daily uptrend, line b, on Tuesday and retested the breakout level at line a. Since September 23, GS is up 5.1% as it has lagged both the DIA and SPY.
- The quarterly pivot is at $169.01, which also corresponds to the September highs.
- There is further support in the $165-$166 area.
- The relative performance did not confirm the breakout in prices and has now dropped below its uptrend line c.
- The weekly RS line (not shown) did not confirm the new highs and has dropped below its WMA.
- The daily volume did increase over the past week but the on-balance volume (OBV) is just barely below its WMA.
- The weekly OBV is positive and did confirm the new highs.
- There is first resistance at $174.50 with stronger in the $176 area.
Nike Inc. (NKE) peaked at $80.26 in the middle of December but turned lower after it announced pretty good earnings. Since September 23, NKE is up 6.9%, which was better than GS but worse than DIA or SPY.
- The daily chart shows a solid downtrend, line e, from the December highs.
- NKE has reached the 38.2% Fibonacci retracement support at $73.40, which was calculated from the August lows.
- The 50% support is at $71.29 with the early October lows at $69.96.
- The close last week was below the quarterly pivot at $76.29 with further resistance at $78-$79.
- The daily relative performance flattened out while NKE was making its highs.
- The RS line completed its top on December 12, and it is now testing longer-term support at line f.
- The daily OBV broke its uptrend, line g, last month and is now in a clear downtrend.
- The weekly OBV (not shown) dropped below its rising WMA last week and could trigger an AOT buy signal.
What It Means: On a one-year basis, Visa Inc. (V) is up 47.4%, Goldman Sachs (GS) is up 21.3%, and Nike Inc. (NKE) is up 40%. This compares to a one-year gain of 28.7% in the Spyder Trust (SPY), and 23.1% in the SPDR Dow Jones Industrials (DIA) so Goldman Sachs (GS) is the laggard.
It also has been weaker than SPY since it was added to the Dow Industrials in September. Since the Dow Industrials is a price-weighted index, movements in GS will have a greater impact on the Dow than Nike Inc. (NKE) but less than Visa Inc. (V).
How to Profit: No new recommendation


