With big banks struggling to generate growth in this post-Great-Recession environment, MoneyShow’s Tom Aspray puts his contrarian hat on to see if now is a good time to go bargain hunting in this beaten-down sector.
The new all-time highs in the S&P 500 and Dow Industrials have many looking for stocks, market sectors, or industry groups that have not rallied with the overall market. This can be a valid strategy if it is supported by the relative performance and volume analysis.
The market frequently undergoes sector rotation as the market leaders undergo a pause in their uptrends before they move higher again. The fact that the price highs are confirmed by the technical studies increase the odds that it is a pullback and not signs of a more significant top.
Many investors are wondering whether the beaten down big banks are ready to catch up with the overall market. They are the favorites of most institutional analysts as few ever issue sell signals on these banks and now they are being touted by others because of their supposedly attractive valuations.
Of course, this was the argument that was used by some in 2009 through 2011, but stocks like Citigroup (C) lost an average of 17% during those years while the Spyder Trust (SPY) averaged a 14.4% gain. Is now the time to be bargain hunting in these big banks?
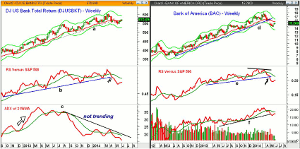
Chart Analysis: The chart of the DJ US Banks Total Return (DJUSBKT) reached its weekly starc+ band in March as it made a high of 607.37.
- The support at line a was violated in April and then broken on a closing basis in early May.
- A drop below the recent low at 545 will complete the weekly top.
- The weekly starc- band is at 529 with the late 2013 low in the 496 area, which is 10% below current levels.
- The relative performance dropped below its WMA in early April and soon violated the trendline support at line b.
- The RS line has dropped well below its WMA, which indicates that the index is clearly not a market leader.
- The ADX analysis completed its top formation in August 2013 as it entered the non-trending mode.
- The ADX line has again dropped to new lows, closing at 16, and it will take quite a while before it could move back to the trending mode.
- The ADX was trending in late 2012 and early 2013.
- There is key resistance now at 577 and a weekly close above this level would be positive.
Bank of America (BAC) took a big hit in late April when it revealed its accounting error but the uptrend, line d, had previously been broken.
- The stock has rebounded back towards its declining 20-day EMA at $15.65.
- The weekly starc+ band is at $16.30 with the quarterly pivot at $16.97.
- BAC also came very close to its starc+ band as it was peaking in the middle of March.
- The relative performance did not make a new high with prices and has now dropped below the support at line e.
- The WMA of the RS line is now clearly declining.
- Volume started moving out of BAC before the news hit as the OBV dropped below its WMA in early April.
- The OBV rallied back to its WMA before the stock gapped lower.
- This triggered an AOT sell signal.
- The OBV has now broken the support at line f.
- The monthly pivot is at $14.94 with the projected pivot support at $14.
NEXT PAGE: 2 More Big Banks to Watch
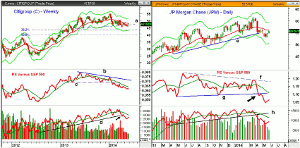
|pagebreak|Citigroup Inc. (C) has rallied nicely from the May low of $46.08 but is still below the April high at $48.61.
- The stock has been below its quarterly pivot at $49.68 for the past two months.
- The weekly chart support at line a was broken last month with the 38.2% Fibonacci support at $43.54 along with the starc- band.
- The relative performance peaked in early 2013 and formed a negative divergence, line b, in early 2014.
- This divergence was confirmed when the RS line dropped below its support at line c.
- The RS line is below its WMA and still in a well-established downtrend.
- The on-balance volume (OBV) broke its uptrend, line d, in early April and is now in a well-established downtrend.
- The daily OBV (not shown) is also acting weaker than prices.
JP Morgan Chase (JPM) is the best ranked of the three banks even though it has lost 5.1% this year compared to a 4.1% gain in the Spyder Trust (SPY). It does have a much higher yield at 2.90%.
- The support from the 2013 lows, line e, was broken in May.
- JPM has now rebounded back to its 20-week EMA with gap resistance at $56.05 to $57.38.
- The quarterly pivot is at $58.43 with the weekly starc+ band at $59.17.
- The relative performance formed a long-term divergence, line f, as JPM peaked at $61.06 in March.
- A daily LCD was triggered one day after the highs with a weekly signal following soon after.
- The RS line has broken more important support at line g, which confirmed the divergence.
- The weekly OBV dropped through major support, line h, at the start of April.
- The OBV has turned up but it is still well below its declining WMA.
- There is initial support at $53.06 with the monthly projected pivot support at $51.57.
What It Means: The weekly analysis of these three banks suggests that the recent rallies are likely to fail. All three of these banks are heavily owned by institutions, for example they own 75% of JP Morgan Chase (JPM). This could limit their upside as the number of potential buyers has been reduced.
For those not in the market, I recommended on Friday that you start a dollar cost averaging program for three widely diversified ETFs including Vanguard Large Cap ETF (VV). This ETF has all three of these banks stocks in their portfolio with the largest (1.18%) in JP Morgan Chase (JPM). Therefore, any drop in a single stock is unlikely to have much of an impact.
I am looking for signs of a bottom in the regional banks but the SPDR KBW Regional Bank ETF (KRE) needs a strong weekly close to complete its bottom formation.
How to Profit: No new recommendation.


