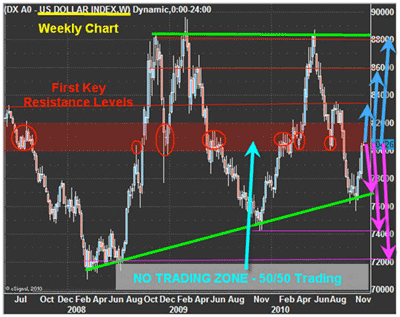
As you can see on the chart, for the past three weeks, the US dollar index has been in a strong uptrend and has now reached the first resistance level. The point of this chart is to show you that if you step out to the next longer time frame, you can get a solid feeling of where a trade will find major support and resistance levels.
In any trade, no matter if it's a stock, commodity, or currency, if the price is trading in the middle of a large range like on this chart, you should not be taking large positions. Charts that look like the one below almost always become a simple 50/50 bet (gamble) on the market; not a good winning strategy unless you are very experienced at managing your trades and money.
If you are going to trade the US dollar, then you want to focus on the underlying trend, and you do that by looking at the next larger time frame. For example, if you focus on trading the daily chart, then you must step back each week and review the weekly chart to be sure you are trading with the underlying trend, which is up for the dollar right now.
By Chris Vermeulen of TheDailyGold.com


