Richard Lee, contributor to Investopedia.com, explains a chart pattern similar to a double top, but with key differences.
It's better to get in on the start of a trend, rather than to be at the end of it. That's why currency traders are always looking to get in the door once the market signals a potential turn. And some even desire a better edge, maybe looking to get in before a trend reversal starts.
For those of us who can't predict the future, there are certain technical formations that can help support our inclinations that the herd may be changing directions. One such pattern is the “tweezer.”
Although relatively unknown to the broader market, the tweezer may be one of the best indications that a short- (or long-) term trend may be nearing its end. Drawing similarities with the more popular double top/bottom, the tweezer can produce high-probability setups in the foreign exchange market.
Double Tops/Bottoms: A Classic
Some of the first technical formations that certain students of technical analysis are taught is the double top or bottom. The longer-term study is right up there with support and resistance, flags and pennants, and the doji candle. And it remains popular even today.
Simply, the double top (or bottom) reversal is a pattern that tends to form after a prolonged extension upward (or downward). It signifies that the energetic momentum from the previous uptrend has stalled, leaving the door open to potential weakness through significant selling pressure.
The following battle between buyers and sellers lasts temporarily, and ends with a final push upward before we see the price action decline. This final push creates a second peak in an otherwise stable channel pattern, forming a double top.
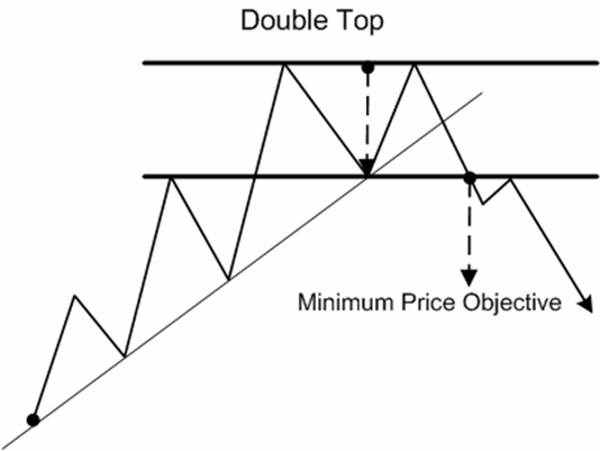
Here is a general example of a double top and the expected profit range, which is equal to the size of the tops.
The price objective is approximate, of course. Traders know that price trades in zones rather than specific levels to the penny.
Tweezers: The New
Similar to the bearish diamond formation in popularity, tweezers (or kenuki) are relatively unknown, partly because they are strikingly similar to double tops/bottoms.
The key difference is in the timing of these two formations. Relatively reserved for the short term, tweezers are composed of two or more consecutive candle sessions. Any more than approximately eight to ten candle sessions and we may well be looking at a double top or bottom percolating. However, given the short time frame, complete tweezer formations tend to happen quickly.
Price is another important factor with the tweezer. In a top or bottom formation, the prongs have exactly the same high prices (in a tweezer top) or low prices (in a tweezer bottom). This idea is key, as it establishes the fact that the price level itself was not broken.
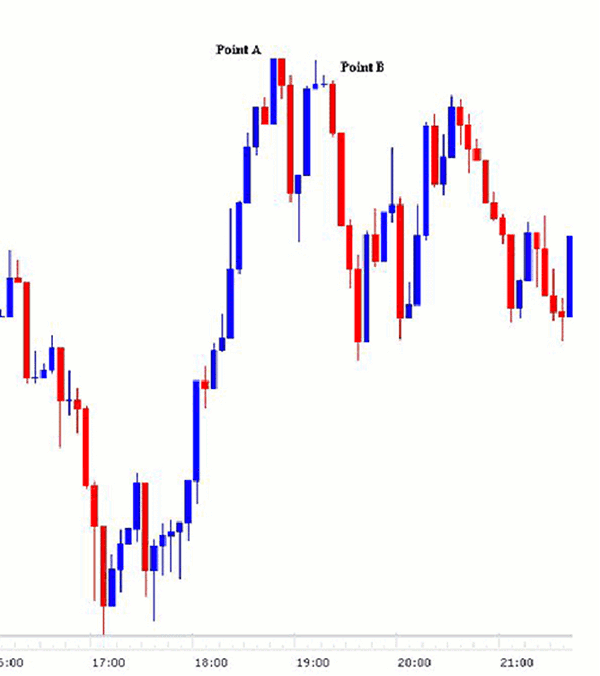
In the chart below, we have a typical tweezer top on a five-minute chart. After an advance higher from previous support, buyers seem to be losing steam. As a result, the first high (point A) is set.
After a short, four-session downturn, buyers make a final push higher, marking the second high (point B) at the exact same price. This falls within our definition of a top. The strength of the resistance, and the fact that the price was tested again and failed, helps underlying selling pressure spark the short-term price decline.
Up Next: Something to keep in mind...
|pagebreak|Keep in Mind
1. The same high or low has to be tested (this is very important).
2. The formation follows an extended advance or decline.
3. Tweezer tops and bottoms tend to form with two or more candles.
4. Additional formations are better. Dojis or hammers that create the second peak will add to the signal as it confirms a shift in sentiment.
Trading the Formation
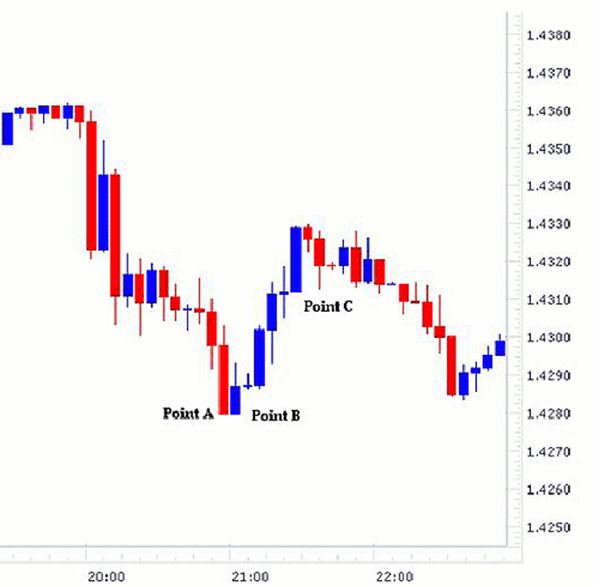
Now let's take a look at applying this setup in the market. Taking a past chart of the GBP/USD currency pair, we see a perfect example in the short-term, five-minute charts (Figure 3 below). Here, the tweezer occurs with just two candle sessions following an extension lower from $1.4360 resistance.
1. The first low (point A) is established as the last candle in the downtrend closes at $1.4279 in the GBP/USD.
2. The second low (point B) is established as the following candle session opens at the $1.4279 low and does not proceed to break it. As a result, we have made the low price twice without violating $1.4279.
3. After the second candle session has closed, we place an entry two pips above the close price. A corresponding stop order will be placed just five pips below the $1.4279.
4. As a result, keeping with a 2:1 risk-reward profile, the take-profit point is at $1.4319 (point C), 30 pips higher.
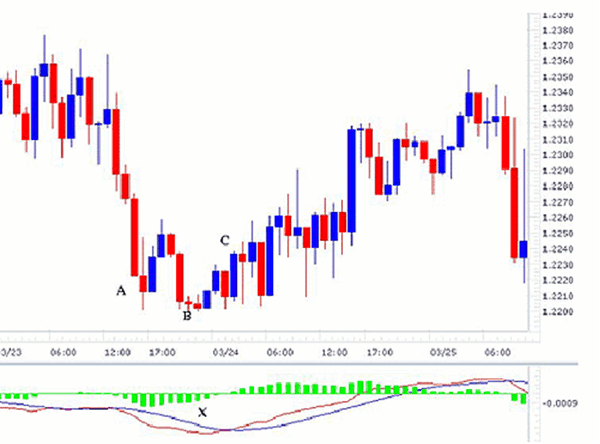
For a slightly longer-term trade, an oscillator is an especially good confirmation tool. In Figure 4 below, we simply add a MACD to confirm our USD/CAD short-term trade opportunity.
1. The first low is set at $1.2201 (point A).
2. The second low is set at $1.2201 (point B), three candle sessions apart. Confirmation of this trade opportunity surfaces as it appears a MACD bullish convergence has emerged (point X), lending an upside bias.
3. After the close of the second candle, we place an entry order two pips above the close price of $1.2207, or $1.2209.
4. At the same time, a stop order is placed five pips below the low at $1.2196.
5. The take-profit or limit order is placed 22 pips above, corresponding to a 2:1 risk-reward ratio at $1.2231 (point C).
Precise and short, the tweezer setup is a great formation that can be used by the currency trader, as FX price action tends to follow technical patterns more than any other market. This leaves support and resistance to be tested and retested, giving the opportunity for these formations to surface.
Adding strict discipline and rigid risk management rules will help these setups increase a trader's arsenal.
Richard Lee is a contributor to Investopedia.com.


