Successful forex trading using technical analysis hinges a lot on the correct application of technical indicators, and Fibonacci tools are not an exception, says Alexander Collins of PipBurner.com.
It is pretty easy to apply a tool like the Fibonacci tool retrospectively when the price action is all done and nicely fits, but the real challenge is how to apply the Fibonacci tools when trying to determine where a retracement action is going to end for a renewed trend move to resume. In this piece, we will try to identify common mistakes that traders make when using the Fibonacci tools and how to avoid them.
1. Plotting Fibonacci Retracements on a Short Time Frame
This is perhaps the greatest mistake made by traders when using Fibonacci tools such as the Fibo retracement tool. Why is this so? In forex, the market activity in a short time frame such as the 15-minutes or 1-hour time frame is too short to effectively determine the trend of a currency. What the trader may see as a strong downtrend on a 1-hour chart or a 4-hour chart may actually be a retracement on a daily chart. Trying to plot a Fibonacci retracement tool on the shorter time frame will only end in disaster. The trend pattern of currencies on a longer time frame such as the daily chart is usually a better determinant of the trend. The best thing to do here is to use the longer time frame to determine the trend, apply the tool and then switch to the shorter time frame to make your entry determination.
2. Over Reliance on the Fibonacci Tools
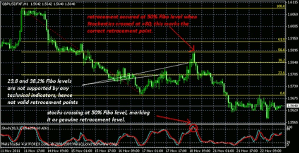
In forex, it is a bad practice to use only one indicator to carry out your technical analysis. Confirmation of the entry is best done using two or three indicators that supplement each other, and the Fibonacci tools are not an exception. To give an example, let us assume a currency pair is undergoing a downward retracement following a particularly strong uptrend. Where do you possibly think the retracement will halt, especially given the fact that there are five possible retracement levels (23.8%, 38.2%, 50%, 61.8%, 100%)? This is where you have to turn to other indicators such as the stochastics, MACD, or RSI for help.

Always confirm entries with more than one indicator.
Click
to Enlarge
3. Misapplication of the Fibonacci Tool
Many times, traders simply misapply it. What does misapplication mean? Fibo tools are best plotted from the swing high to the swing low. If the trader does not use the highest or lowest points on the chart for tracing the tool, an inaccuracy has set in and this is a clear example of misapplication. Another example is tracing the tool from a candle shadow to a candle body or vice versa. A trader must be consistent. For the best results, always trace from the tip of the upper shadow (the wick) of the candle making the high, to the tip of the lower shadow of the candle making the swing low.
These are the common mistakes made by traders when using the Fibonacci tools. Avoid these mistakes to get the best results possible from your Fibonacci tools.
By Alexander Collins of PipBurner.com


