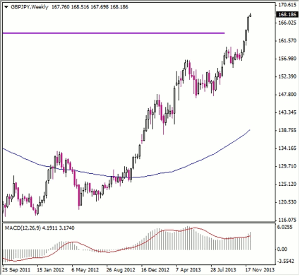
The Japanese yen just keeps on getting weaker, extending bullish runs in its crosses, notes Mike Kulej of FXMadness.com.
Interestingly, this time around the technical picture is not almost identical in these instruments, as it often happened in the past. For example, the commodity currencies are not very bullish versus the JPY, reflecting their own softness. On the other hand, the European currencies and the USD continue to climb to levels not seen in several years. Particularly impressive is the GBP/JPY, which reached as high as the 168 level and appears on track to test the 170 handle.
Under most circumstances, this indicates a mature trend, ready for either substantial correction or even a reversal. In this example, however, there is no technical reason to anticipate a long-term reversal. To the contrary—the price has just breached the important resistance of about 163, climbing ever higher. The next established resistance level is at the 190 handle. However, that was formed during the main selloff of 2008, when volatility was much higher than it is today. Because trading conditions are significantly different now, those looking for signs of weakness in this pair on the weekly chart could find it at key psychological barriers, such as 170 or 180. They should be accompanied by major candlestick reversal pattern. Until then, the long-term trend remains bullish.
The daily chart of the GBP/JPY looks a little more encouraging, if you are looking for some corrective action. We can see three-four major consolidations, all leading to higher prices. Most of the time, an average trend does not have more of these staging bases (consolidations). More importantly, after the most recent breakout, the price posted sharp gains, resulting in a parabolic run up. This rate of climb is not sustainable for very long, suggesting correction in the near future. When it happens, the GBP/JPY is likely drop sharply, perhaps back to about 160. Not necessarily a reversal of the main trend, but a pullback large enough to present good trading opportunity. In order to time this possibility, we should look closer at smaller scale charts.
By Mike Kulej of FXMadness.com


