Using the Elliott Wave Principle that is currently displaying three different patterns in the EUR/CAD, Jeremy Wagner of DailyFX Education details how this setup might be played.
This is the second part of this article series. The first part was regarding the strong trend the Chinese yuan, which is now available to trade.
The objective of this series is to find tradable trends when the market appears to be stagnating. Trend following is one of the most popular strategies used by new and experienced traders. When market volatility dies down, the old trends tend to move sideways creating frustration for the trader. There are strong trends out there and this series will help shine a light on those trends presenting tradable opportunities.
Today’s opportunity is with the EUR/CAD. There are three patterns appearing at different time frames suggesting a meaningful top is in place and that more downside potential remains.
EUR/CAD Trend Shifts Down

Created using FXCM's Marketscope 2.0 charts
Click to Enlarge
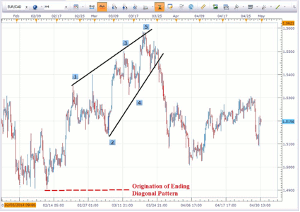
From a four-hour price chart, it appears the EUR/CAD has carved out an ending diagonal. In this case, it is a bearish pattern that suggests prices will likely fall towards the origination of the pattern at 1.4900. Keep this level in mind as we zone in on smaller time frames to fine tune our entry and exit plan.
Two Different Time Frames Forming Five Waves Down

Created using FXCM's Marketscope 2.0 charts
Click to Enlarge
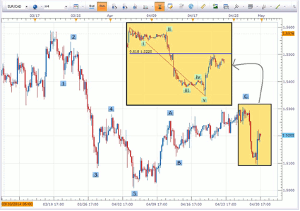
From the high on March 20, 2014, prices clearly fell in five waves in impulsive fashion to a low of 1.5003. So far, prices have only partially retraced the high from March.
The Elliott Wave Principle illustrates that trends move in a five wave impulsive fashion and corrects in three waves (the blue labels above and the corrective waves labeled as A-B-C). Therefore, with a five wave move lower, this suggests that the trend may be shifting from up to down with a minimum target of 1.4900, which was the origination of the ending diagonal pattern (first chart).
Upon closer inspection, we can see how the price action over the past two days has yielded clue of a bearish trend. Zooming into the tan boxed area, we can see another smaller degree five wave move lower (green labels). All of these patterns suggest the EUR/CAD pair has likely put in a top with an initial target of 1.4900.
The Trade Set Up
Therefore, our trading opportunity is to short the EUR/CAD in the 1.5200 to 1.5230 zone. Our stop loss will be just above the April 27 high at 1.5320. Look to take profits near 1.4900.

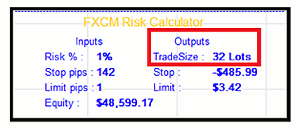
FXCM’s Risk Management Calculator App
Click to Enlarge
Therefore, if we risk 90 pips with an opportunity to make over 300 pips, this provides us with better than a 1-to-3 risk-to-reward ratio.
By Jeremy Wagner, Head Forex Trading Instructor, DailyFX Education


